Referendum General Election Results Comparison - California
Note: The Google advertisement links below may advocate political positions that this site does not endorse.
MapPieYearTotalDRIMargin%MarginDemRepIndOth.DemRepIndOther 
                 
MapMap2022 5,346,840 1 0 2 2,130,018 39.84% 69.92% 0.00% 30.08% 0.00% 3,738,429 0 1,608,411 0
MapMap2018 12,045,441 2 0 1 3,057,155 25.38% 37.31% 0.00% 62.69% 0.00% 4,494,143 0 7,551,298 0
MapMap2016 13,966,061 2 0 1 1,992,021 14.26% 42.87% 0.00% 57.13% 0.00% 5,987,020 0 7,979,041 0
Map2008 6,887,534 2 0 1 802,588 11.65% 44.17% 0.00% 55.83% 0.00% 3,042,473 0 3,845,061 0
Map1998 5,897,928 2 0 1 2,418,986 41.01% 29.49% 0.00% 70.51% 0.00% 1,739,471 0 4,158,457 0
Map1990 4,938,576 2 0 1 1,806,868 36.59% 31.71% 0.00% 68.29% 0.00% 1,565,854 0 3,372,722 0

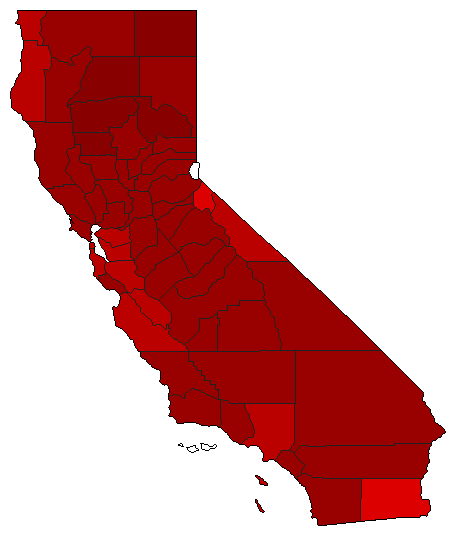
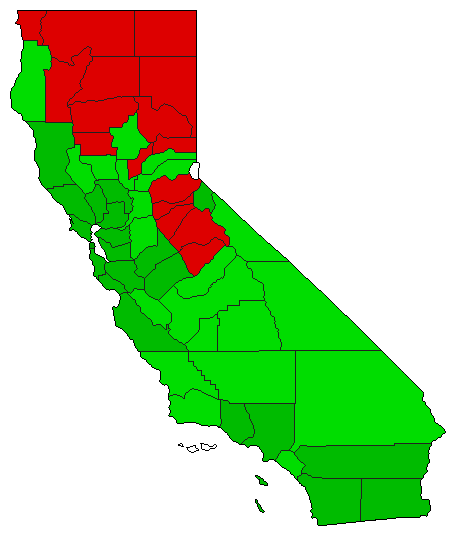
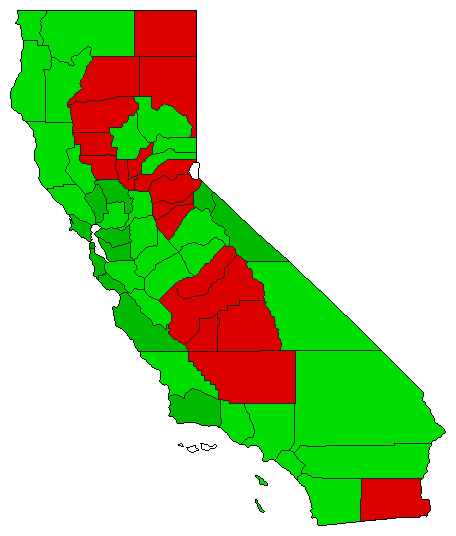
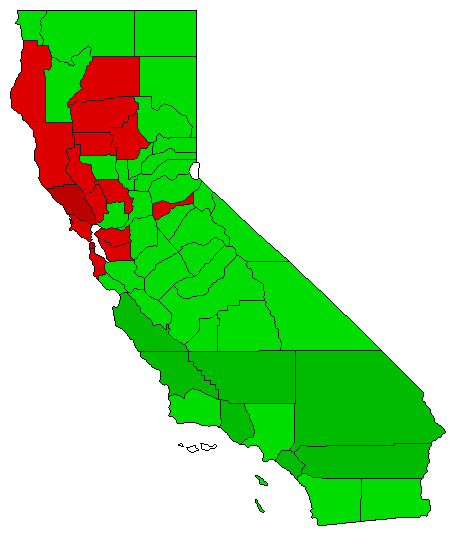
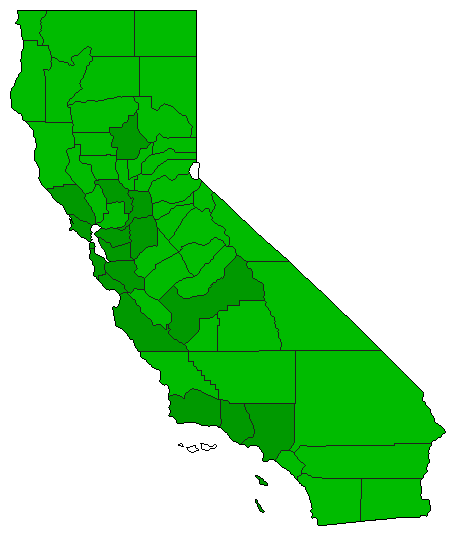
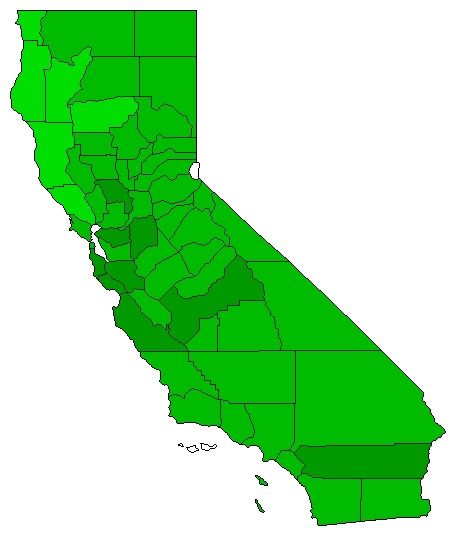
California Results for 1990

Login

Terms of Use - DCMA Policy - Privacy Policy and Cookies


© Dave Leip's Atlas of U.S. Elections, LLC 2019 All Rights Reserved