| Map | Pie | Office | Total | D | R | I | Margin | %Margin | Dem | Rep | Ind | Oth. | Dem | Rep | Ind | Other | | | | | | | | | | | | | | | | | | |
|---|
| | | Map | Pie | Initiative | Total Vote | N | | Y | Margin | %Margin | No | | Yes | Oth. | No | | Yes | |
 | | Referendum |
1,590,929 |
2 |
0 |
1 |
431,689 |
27.13% |
36.43% |
0.00% |
63.57% |
0.00% |
579,620 |
0 |
1,011,309 |
0 |
 | | Initiative |
1,609,064 |
1 |
0 |
2 |
566,742 |
35.22% |
67.61% |
0.00% |
32.39% |
0.00% |
1,087,903 |
0 |
521,161 |
0 |
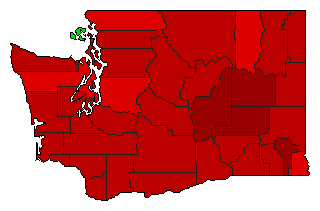
 | | Initiative |
1,690,694 |
1 |
0 |
2 |
697,314 |
41.24% |
70.62% |
0.00% |
29.38% |
0.00% |
1,194,004 |
0 |
496,690 |
0 |
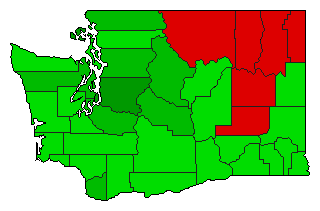
 | | Initiative |
1,651,242 |
1 |
0 |
2 |
319,096 |
19.32% |
59.66% |
0.00% |
40.34% |
0.00% |
985,169 |
0 |
666,073 |
0 |
 | | Initiative |
1,671,095 |
1 |
0 |
2 |
95,881 |
5.74% |
52.87% |
0.00% |
47.13% |
0.00% |
883,488 |
0 |
787,607 |
0 |
 | | Initiative |
1,666,208 |
1 |
0 |
2 |
347,720 |
20.87% |
60.43% |
0.00% |
39.57% |
0.00% |
1,006,964 |
0 |
659,244 |
0 |
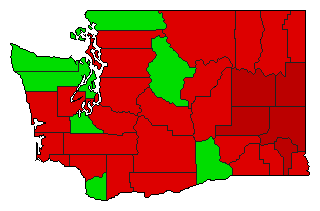
 | | Initiative |
1,618,036 |
2 |
0 |
1 |
99,518 |
6.15% |
46.92% |
0.00% |
53.08% |
0.00% |
759,259 |
0 |
858,777 |
0 |
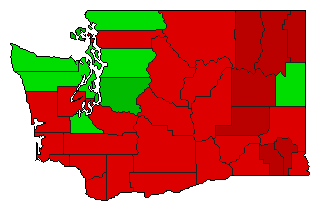
 | | Initiative |
1,575,465 |
2 |
0 |
1 |
429,299 |
27.25% |
36.38% |
0.00% |
63.62% |
0.00% |
573,083 |
0 |
1,002,382 |
0 |
|
