| Map | Pie | Year | Total | D | R | I | Margin | %Margin | Dem | Rep | Ind | Oth. | Dem | Rep | Ind | Other | | | | | | | | | | | | | | | | | | |
|---|
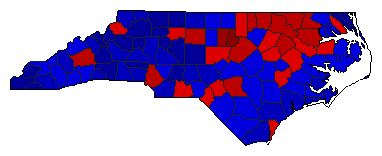 |  | 2020 |
5,386,127 |
1 |
2 |
0 |
125,013 |
2.32% |
51.16% |
48.84% |
0.00% |
0.00% |
2,755,570 |
2,630,557 |
0 |
0 |
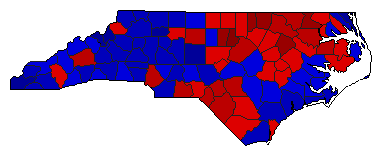 |  | 2016 |
4,531,425 |
1 |
2 |
0 |
204,951 |
4.52% |
52.26% |
47.74% |
0.00% |
0.00% |
2,368,188 |
2,163,237 |
0 |
0 |
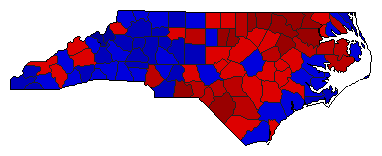 | | 2012 |
4,334,853 |
1 |
2 |
0 |
328,691 |
7.58% |
53.79% |
46.21% |
0.00% |
0.00% |
2,331,772 |
2,003,081 |
0 |
0 |
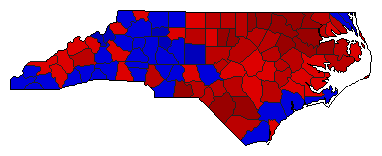 | | 2008 |
4,079,814 |
1 |
2 |
0 |
553,976 |
13.58% |
56.79% |
43.21% |
0.00% |
0.00% |
2,316,895 |
1,762,919 |
0 |
0 |
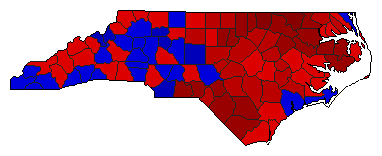 | | 2004 |
3,334,694 |
1 |
2 |
0 |
488,476 |
14.65% |
57.32% |
42.68% |
0.00% |
0.00% |
1,911,585 |
1,423,109 |
0 |
0 |
 | | 2000 |
2,777,730 |
1 |
2 |
0 |
246,422 |
8.87% |
54.44% |
45.56% |
0.00% |
0.00% |
1,512,076 |
1,265,654 |
0 |
0 |
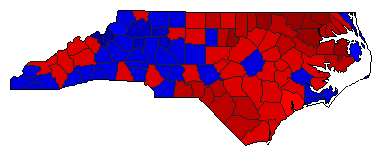 | | 1996 |
2,494,325 |
1 |
2 |
0 |
207,293 |
8.31% |
53.48% |
45.17% |
0.00% |
1.35% |
1,333,994 |
1,126,701 |
0 |
33,630 |
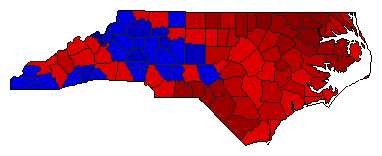 |  | 1984 |
2,076,787 |
1 |
2 |
0 |
256,289 |
12.34% |
56.17% |
43.83% |
0.00% |
0.00% |
1,166,538 |
910,249 |
0 |
0 |
 |  | 1968 |
1,429,501 |
1 |
2 |
0 |
155,311 |
10.86% |
55.43% |
44.57% |
0.00% |
0.00% |
792,406 |
637,095 |
0 |
0 |
|


