| Map | Pie | Office | Total | D | R | I | Margin | %Margin | Dem | Rep | Ind | Oth. | Dem | Rep | Ind | Other | | | | | | | | | | | | | | | | | | |
|---|
| | | Map | Pie | Initiative | Total Vote | N | | Y | Margin | %Margin | No | | Yes | Oth. | No | | Yes | |
 | | Initiative |
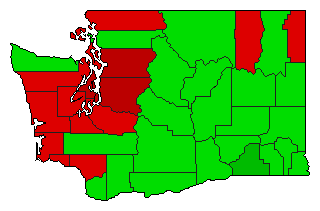
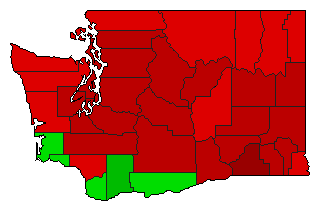
1,810,552 |
1 |
0 |
2 |
243,682 |
13.46% |
56.73% |
0.00% |
43.27% |
0.00% |
1,027,117 |
0 |
783,435 |
0 |
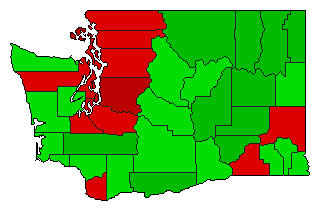
 | | Initiative |
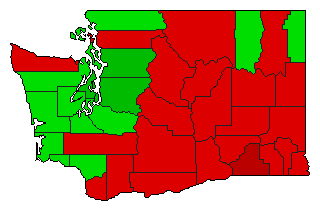
1,810,552 |
2 |
0 |
1 |
243,682 |
13.46% |
43.27% |
0.00% |
56.73% |
0.00% |
783,435 |
0 |
1,027,117 |
0 |
 | | Initiative |
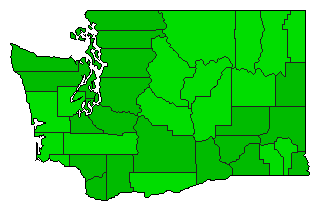
1,823,578 |
2 |
0 |
1 |
483,128 |
26.49% |
36.75% |
0.00% |
63.25% |
0.00% |
670,225 |
0 |
1,153,353 |
0 |
 | | Initiative |
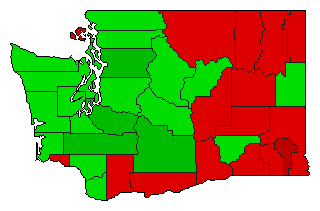
1,762,601 |
2 |
0 |
1 |
226,913 |
12.87% |
43.56% |
0.00% |
56.44% |
0.00% |
767,844 |
0 |
994,757 |
0 |
 | | Initiative |
1,788,361 |
1 |
0 |
2 |
365,475 |
20.44% |
60.22% |
0.00% |
39.78% |
0.00% |
1,076,918 |
0 |
711,443 |
0 |
 | | Initiative |
1,814,562 |
1 |
0 |
2 |
167,830 |
9.25% |
54.62% |
0.00% |
45.38% |
0.00% |
991,196 |
0 |
823,366 |
0 |
|
