| Map | Pie | Year | Total | D | R | I | Margin | %Margin | Dem | Rep | Ind | Oth. | Dem | Rep | Ind | Other | | | | | | | | | | | | | | | | | | |
|---|
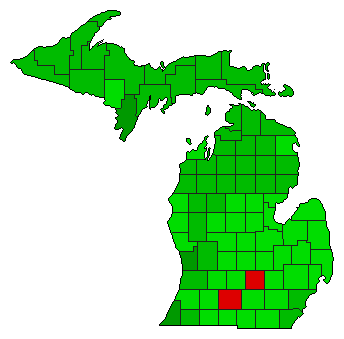
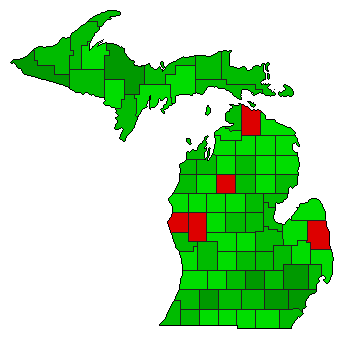 |  | 2022 |
4,271,694 |
2 |
0 |
1 |
1,405,386 |
32.90% |
33.55% |
0.00% |
66.45% |
0.00% |
1,433,154 |
0 |
2,838,540 |
0 |
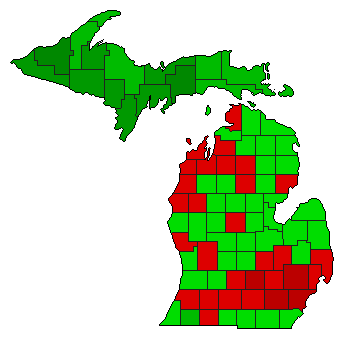
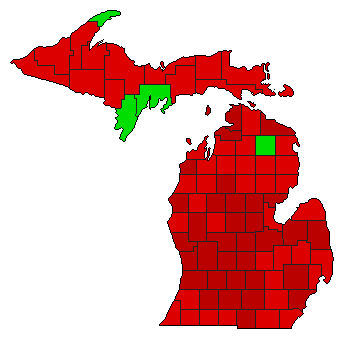
 |  | 2020 |
4,929,254 |
2 |
0 |
1 |
3,380,236 |
68.58% |
15.71% |
0.00% |
84.29% |
0.00% |
774,509 |
0 |
4,154,745 |
0 |
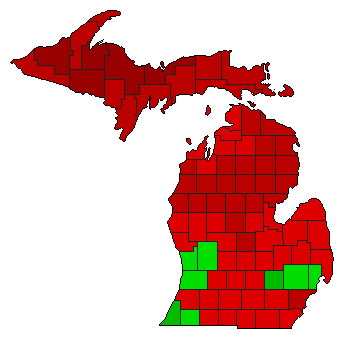
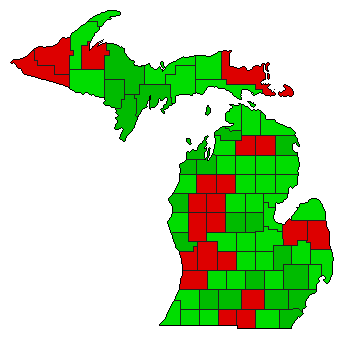
 | | 2014 |
2,924,408 |
1 |
0 |
2 |
288,248 |
9.86% |
54.93% |
0.00% |
45.07% |
0.00% |
1,606,328 |
0 |
1,318,080 |
0 |
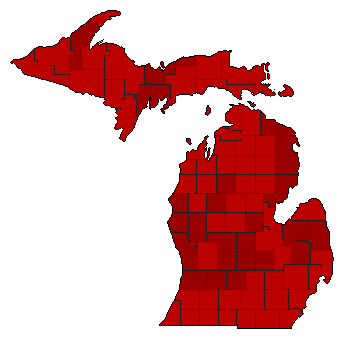
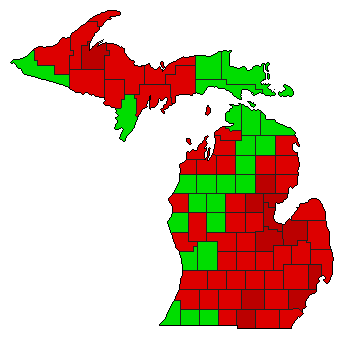
 | | 2012 |
4,500,955 |
1 |
0 |
2 |
240,247 |
5.34% |
52.67% |
0.00% |
47.33% |
0.00% |
2,370,601 |
0 |
2,130,354 |
0 |
 | | 2010 |
2,943,592 |
1 |
0 |
2 |
977,554 |
33.21% |
66.60% |
0.00% |
33.40% |
0.00% |
1,960,573 |
0 |
983,019 |
0 |
 | | 2006 |
3,595,965 |
2 |
0 |
1 |
2,234,247 |
62.13% |
18.93% |
0.00% |
81.07% |
0.00% |
680,859 |
0 |
2,915,106 |
0 |
 | | 2004 |
4,616,169 |
2 |
0 |
1 |
762,727 |
16.52% |
41.74% |
0.00% |
58.26% |
0.00% |
1,926,721 |
0 |
2,689,448 |
0 |
 | | 2002 |
2,974,279 |
1 |
0 |
2 |
575,807 |
19.36% |
59.68% |
0.00% |
40.32% |
0.00% |
1,775,043 |
0 |
1,199,236 |
0 |
 | | 1998 |
2,889,860 |
2 |
0 |
1 |
525,714 |
18.19% |
40.90% |
0.00% |
59.10% |
0.00% |
1,182,073 |
0 |
1,707,787 |
0 |
 | | 1996 |
3,447,261 |
1 |
0 |
2 |
425,135 |
12.33% |
56.17% |
0.00% |
43.83% |
0.00% |
1,936,198 |
0 |
1,511,063 |
0 |
 | | 1976 |
3,279,938 |
1 |
0 |
2 |
1,881,952 |
57.38% |
78.69% |
0.00% |
21.31% |
0.00% |
2,580,945 |
0 |
698,993 |
0 |
 | | 1974 |
2,238,047 |
1 |
0 |
2 |
54,171 |
2.42% |
51.21% |
0.00% |
48.79% |
0.00% |
1,146,109 |
0 |
1,091,938 |
0 |
 | | 1970 |
2,371,865 |
1 |
0 |
2 |
521,903 |
22.00% |
61.00% |
0.00% |
39.00% |
0.00% |
1,446,884 |
0 |
924,981 |
0 |
|
