| Map | Pie | Year | Total | D | R | I | Margin | %Margin | Dem | Rep | Ind | Oth. | Dem | Rep | Ind | Other | | | | | | | | | | | | | | | | | | |
|---|
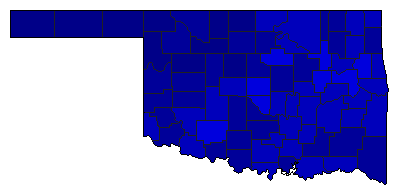 |  | 2018 |
1,162,002 |
2 |
1 |
0 |
278,152 |
23.94% |
38.03% |
61.97% |
0.00% |
0.00% |
441,925 |
720,077 |
0 |
0 |
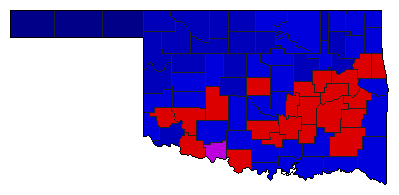 | | 2010 |
1,020,050 |
2 |
1 |
0 |
91,430 |
8.96% |
45.52% |
54.48% |
0.00% |
0.00% |
464,310 |
555,740 |
0 |
0 |
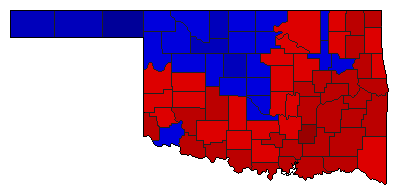 | | 2006 |
911,302 |
1 |
2 |
0 |
37,140 |
4.08% |
52.04% |
47.96% |
0.00% |
0.00% |
474,221 |
437,081 |
0 |
0 |
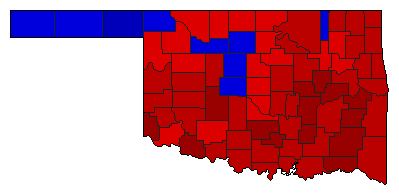 |  | 2002 |
1,009,584 |
1 |
2 |
0 |
164,158 |
16.26% |
58.13% |
41.87% |
0.00% |
0.00% |
586,871 |
422,713 |
0 |
0 |
 | | 1998 |
853,288 |
1 |
2 |
0 |
2,634 |
0.31% |
50.15% |
49.85% |
0.00% |
0.00% |
427,961 |
425,327 |
0 |
0 |
 | | 1994 |
958,887 |
2 |
1 |
0 |
13,165 |
1.37% |
49.31% |
50.69% |
0.00% |
0.00% |
472,861 |
486,026 |
0 |
0 |
 | | 1986 |
868,303 |
1 |
2 |
3 |
228,306 |
26.29% |
60.80% |
34.50% |
4.70% |
0.00% |
527,907 |
299,601 |
40,795 |
0 |
|
