| Map | Pie | Year | Total | D | R | I | Margin | %Margin | Dem | Rep | Ind | Oth. | Dem | Rep | Ind | Other | | | | | | | | | | | | | | | | | | |
|---|
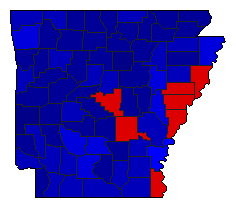
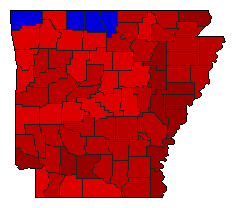
|  | 2022 |
895,968 |
2 |
1 |
0 |
315,602 |
35.22% |
32.39% |
67.61% |
0.00% |
0.00% |
290,183 |
605,785 |
0 |
0 |
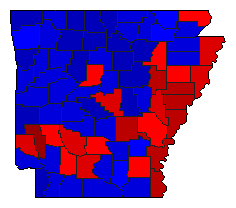
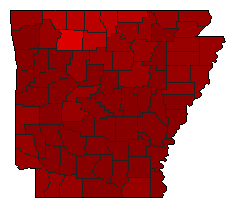
 |  | 2018 |
889,419 |
2 |
1 |
0 |
234,569 |
26.37% |
35.43% |
61.80% |
0.00% |
2.77% |
315,099 |
549,668 |
0 |
24,652 |
 | | 2014 |
832,900 |
2 |
1 |
0 |
69,812 |
8.38% |
43.22% |
51.60% |
0.00% |
5.18% |
359,967 |
429,779 |
0 |
43,154 |
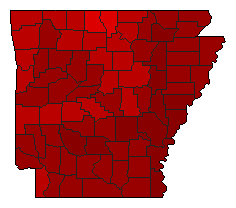 | | 2010 |
722,814 |
1 |
0 |
0 |
332,282 |
45.97% |
72.76% |
0.00% |
0.00% |
27.24% |
525,940 |
0 |
0 |
196,874 |
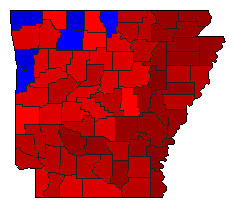 | | 2006 |
758,460 |
1 |
2 |
0 |
161,878 |
21.34% |
58.47% |
37.13% |
0.00% |
4.40% |
443,476 |
281,598 |
0 |
33,386 |
 | | 1998 |
699,411 |
1 |
2 |
0 |
123,723 |
17.69% |
58.84% |
41.16% |
0.00% |
0.00% |
411,567 |
287,844 |
0 |
0 |
 | | 1994 |
696,792 |
1 |
2 |
0 |
424,636 |
60.94% |
80.47% |
19.53% |
0.00% |
0.00% |
560,714 |
136,078 |
0 |
0 |
|
