| Map | Pie | Office | Total | D | R | I | Margin | %Margin | Dem | Rep | Ind | Oth. | Dem | Rep | Ind | Other | | | | | | | | | | | | | | | | | | |
|---|
 |  | Governor |
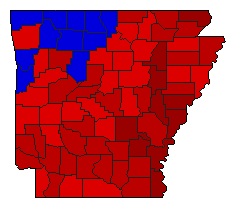
774,680 |
1 |
2 |
3 |
115,725 |
14.94% |
55.61% |
40.67% |
2.04% |
1.69% |
430,765 |
315,040 |
15,767 |
13,108 |
 | | Lt. Governor |
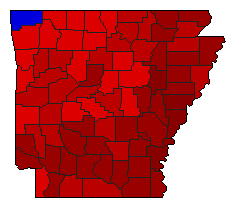
762,705 |
1 |
2 |
0 |
112,275 |
14.72% |
57.36% |
42.64% |
0.00% |
0.00% |
437,490 |
325,215 |
0 |
0 |
 | | Secretary of State |
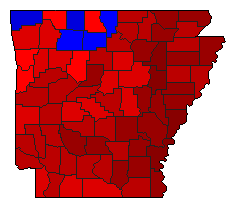
761,087 |
1 |
2 |
0 |
198,782 |
26.12% |
61.56% |
35.44% |
0.00% |
2.99% |
468,548 |
269,766 |
0 |
22,773 |
 | | State Treasurer |
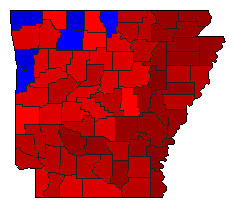
754,942 |
1 |
2 |
0 |
174,819 |
23.16% |
59.67% |
36.51% |
0.00% |
3.82% |
450,450 |
275,631 |
0 |
28,861 |
 | | Attorney General |
758,460 |
1 |
2 |
0 |
161,878 |
21.34% |
58.47% |
37.13% |
0.00% |
4.40% |
443,476 |
281,598 |
0 |
33,386 |
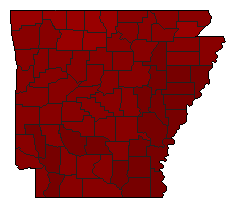 | | State Auditor |
704,015 |
1 |
0 |
2 |
490,985 |
69.74% |
84.87% |
0.00% |
15.13% |
0.00% |
597,500 |
0 |
106,515 |
0 |
|