| Map | Pie | Year | Total | D | R | I | Margin | %Margin | Dem | Rep | Ind | Oth. | Dem | Rep | Ind | Other | | | | | | | | | | | | | | | | | | |
|---|
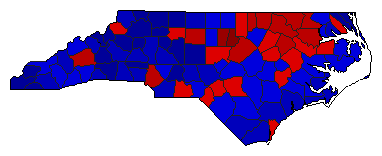 |  | 2020 |
5,365,999 |
1 |
2 |
0 |
94,351 |
1.76% |
50.88% |
49.12% |
0.00% |
0.00% |
2,730,175 |
2,635,824 |
0 |
0 |
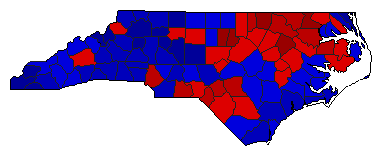 |  | 2016 |
4,512,830 |
1 |
2 |
0 |
6,042 |
0.13% |
50.07% |
49.93% |
0.00% |
0.00% |
2,259,436 |
2,253,394 |
0 |
0 |
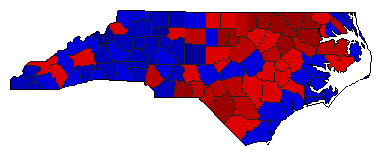 | | 2012 |
4,281,719 |
1 |
2 |
0 |
318,515 |
7.44% |
53.72% |
46.28% |
0.00% |
0.00% |
2,300,117 |
1,981,602 |
0 |
0 |
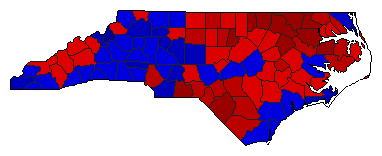 | | 2008 |
4,060,455 |
1 |
2 |
0 |
290,015 |
7.14% |
53.57% |
46.43% |
0.00% |
0.00% |
2,175,235 |
1,885,220 |
0 |
0 |
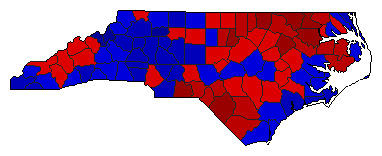 | | 2004 |
3,295,993 |
2 |
1 |
0 |
28,715 |
0.87% |
49.56% |
50.44% |
0.00% |
0.00% |
1,633,639 |
1,662,354 |
0 |
0 |
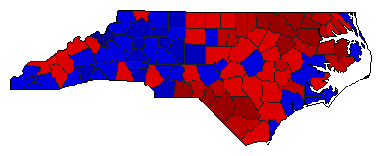 | | 2000 |
2,756,101 |
1 |
2 |
0 |
28,321 |
1.03% |
50.51% |
49.49% |
0.00% |
0.00% |
1,392,211 |
1,363,890 |
0 |
0 |
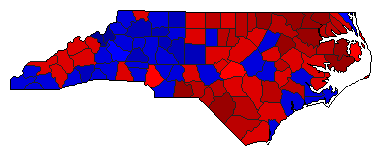 | | 1996 |
2,373,193 |
1 |
2 |
0 |
55,615 |
2.34% |
49.92% |
47.58% |
0.00% |
2.51% |
1,184,665 |
1,129,050 |
0 |
59,478 |
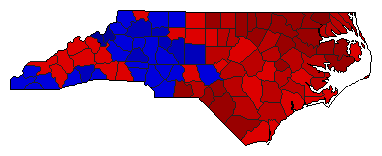 |  | 1984 |
2,016,773 |
1 |
2 |
0 |
171,521 |
8.50% |
54.25% |
45.75% |
0.00% |
0.00% |
1,094,147 |
922,626 |
0 |
0 |
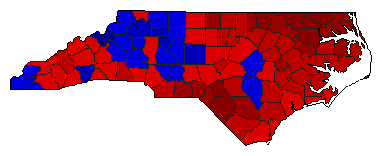 |  | 1968 |
1,402,724 |
1 |
2 |
0 |
152,620 |
10.88% |
55.44% |
44.56% |
0.00% |
0.00% |
777,672 |
625,052 |
0 |
0 |
|


