| Map | Pie | Year | Total | D | R | I | Margin | %Margin | Dem | Rep | Ind | Oth. | Dem | Rep | Ind | Other | | | | | | | | | | | | | | | | | | |
|---|
|  | 2022 |
1,122,949 |
0 |
1 |
0 |
777,626 |
69.25% |
0.00% |
84.26% |
0.00% |
15.74% |
0 |
946,155 |
0 |
176,794 |
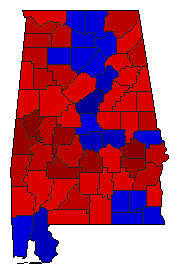
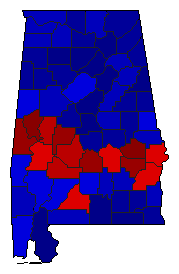 | | 2014 |
1,135,697 |
2 |
1 |
0 |
334,129 |
29.42% |
35.25% |
64.67% |
0.00% |
0.09% |
400,299 |
734,428 |
0 |
970 |
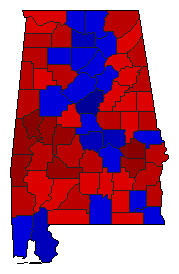
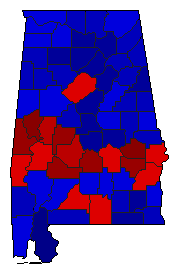 | | 2010 |
1,447,561 |
2 |
1 |
0 |
279,646 |
19.32% |
40.29% |
59.61% |
0.00% |
0.10% |
583,255 |
862,901 |
0 |
1,405 |
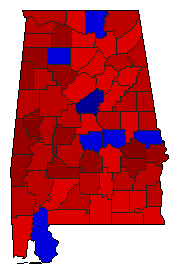
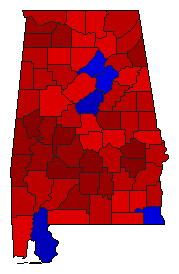 | | 2006 |
1,187,345 |
1 |
2 |
0 |
216,045 |
18.20% |
59.07% |
40.87% |
0.00% |
0.06% |
701,320 |
485,275 |
0 |
750 |
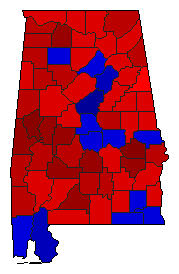 | | 2002 |
1,279,033 |
1 |
2 |
0 |
66,032 |
5.16% |
51.32% |
46.16% |
0.00% |
2.53% |
656,382 |
590,350 |
0 |
32,301 |
 | | 1998 |
1,222,467 |
1 |
2 |
0 |
26,385 |
2.16% |
51.08% |
48.92% |
0.00% |
0.00% |
624,426 |
598,041 |
0 |
0 |
 | | 1994 |
1,108,379 |
2 |
1 |
0 |
24,679 |
2.23% |
48.89% |
51.11% |
0.00% |
0.00% |
541,850 |
566,529 |
0 |
0 |
 | | 1990 |
1,087,274 |
1 |
2 |
0 |
122,808 |
11.30% |
55.65% |
44.35% |
0.00% |
0.00% |
605,041 |
482,233 |
0 |
0 |
|
