Note: The Google advertisement links below may advocate political positions that this site does not endorse.
| Map | Pie | Year | Total | D | R | I | Margin | %Margin | Dem | Rep | Ind | Oth. | Dem | Rep | Ind | Other | | | | | | | | | | | | | | | | | | |
|---|
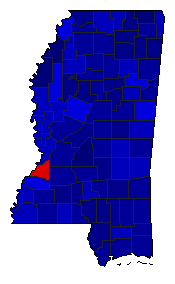
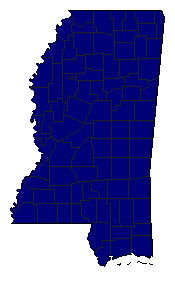 |  | 2019 |
656,902 |
0 |
1 |
0 |
656,902 |
100.00% |
0.00% |
100.00% |
0.00% |
0.00% |
0 |
656,902 |
0 |
0 |
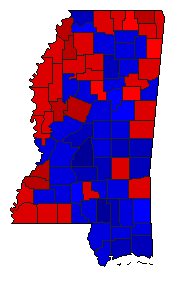
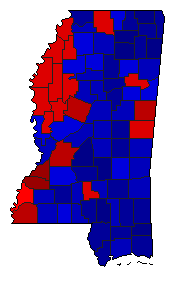 |  | 2015 |
708,880 |
2 |
1 |
3 |
207,702 |
29.30% |
34.69% |
63.99% |
1.32% |
0.00% |
245,899 |
453,601 |
9,380 |
0 |
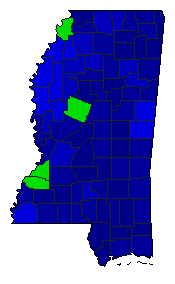 | | 2011 |
787,706 |
0 |
1 |
2 |
403,662 |
51.25% |
0.00% |
75.62% |
24.38% |
0.00% |
0 |
595,684 |
192,022 |
0 |
 | | 2007 |
726,312 |
2 |
1 |
0 |
72,246 |
9.95% |
45.03% |
54.97% |
0.00% |
0.00% |
327,033 |
399,279 |
0 |
0 |
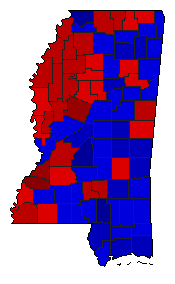
 | | 2003 |
769,504 |
2 |
1 |
0 |
404,920 |
52.62% |
23.69% |
76.31% |
0.00% |
0.00% |
182,292 |
587,212 |
0 |
0 |
 | | 1999 |
722,283 |
2 |
1 |
0 |
95,517 |
13.22% |
41.64% |
54.86% |
0.00% |
3.50% |
300,728 |
396,245 |
0 |
25,310 |
|
