| Map | Pie | Year | Total | D | R | I | Margin | %Margin | Dem | Rep | Ind | Oth. | Dem | Rep | Ind | Other | | | | | | | | | | | | | | | | | | |
|---|
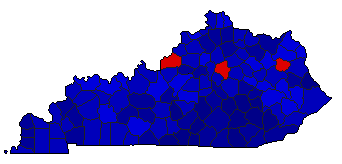
|  | 2023 |
1,285,989 |
2 |
1 |
0 |
240,947 |
18.74% |
40.63% |
59.37% |
0.00% |
0.00% |
522,521 |
763,468 |
0 |
0 |
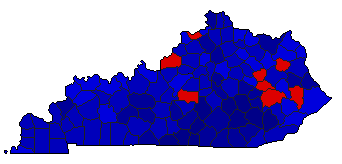
 |  | 2019 |
1,411,109 |
2 |
1 |
0 |
276,315 |
19.58% |
38.63% |
58.21% |
0.00% |
3.16% |
545,099 |
821,414 |
0 |
44,596 |
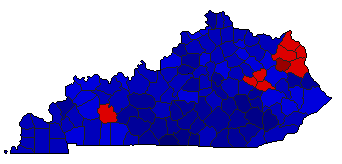
 |  | 2015 |
937,816 |
2 |
1 |
0 |
189,012 |
20.15% |
39.92% |
60.08% |
0.00% |
0.00% |
374,402 |
563,414 |
0 |
0 |
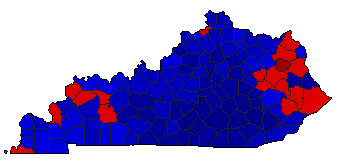
 | | 2011 |
813,846 |
2 |
1 |
0 |
224,520 |
27.59% |
36.21% |
63.79% |
0.00% |
0.00% |
294,663 |
519,183 |
0 |
0 |
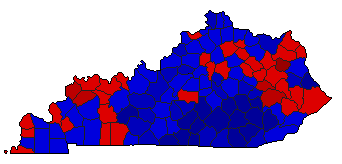
 | | 2007 |
1,006,375 |
2 |
1 |
0 |
281,697 |
27.99% |
36.00% |
64.00% |
0.00% |
0.00% |
362,339 |
644,036 |
0 |
0 |
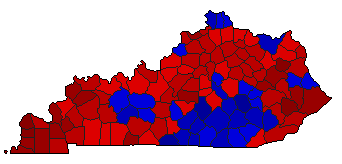
 | | 2003 |
1,046,704 |
2 |
1 |
0 |
109,312 |
10.44% |
44.78% |
55.22% |
0.00% |
0.00% |
468,696 |
578,008 |
0 |
0 |
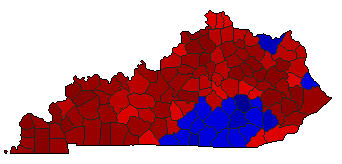
 |  | 1995 |
900,452 |
1 |
2 |
0 |
130,596 |
14.50% |
57.25% |
42.75% |
0.00% |
0.00% |
515,524 |
384,928 |
0 |
0 |
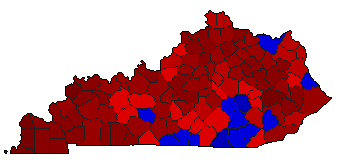
 |  | 1991 |
697,806 |
1 |
2 |
0 |
233,144 |
33.41% |
66.71% |
33.29% |
0.00% |
0.00% |
465,475 |
232,331 |
0 |
0 |
 | | 1987 |
633,702 |
1 |
2 |
0 |
231,522 |
36.53% |
68.25% |
31.72% |
0.00% |
0.03% |
432,517 |
200,995 |
0 |
190 |
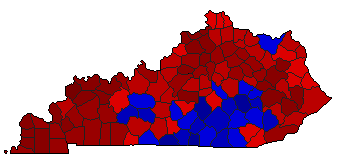 | | 1983 |
784,021 |
1 |
2 |
0 |
216,229 |
27.58% |
63.79% |
36.21% |
0.00% |
0.00% |
500,125 |
283,896 |
0 |
0 |
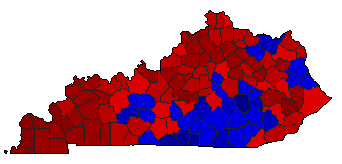 | | 1979 |
768,033 |
1 |
2 |
0 |
182,597 |
23.77% |
61.89% |
38.11% |
0.00% |
0.00% |
475,315 |
292,718 |
0 |
0 |
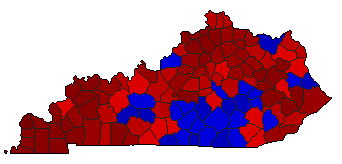 | | 1975 |
619,685 |
1 |
2 |
0 |
134,669 |
21.73% |
60.87% |
39.13% |
0.00% |
0.00% |
377,177 |
242,508 |
0 |
0 |
|