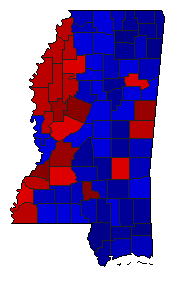
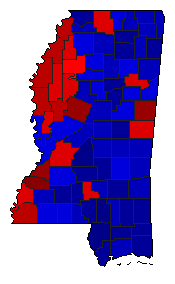
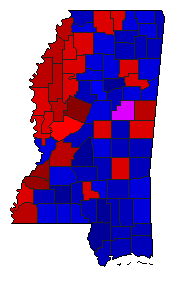
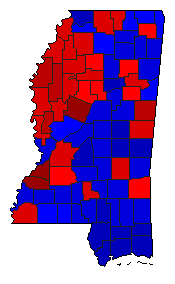
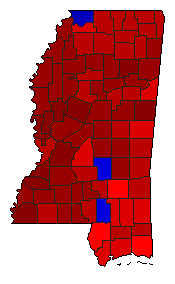
Agriculture Commissioner General Election Results Comparison - Mississippi
Note: The Google advertisement links below may advocate political positions that this site does not endorse.
MapPieYearTotalDRIMargin%MarginDemRepIndOth.DemRepIndOther 
                 
MapMap2019 867,557 2 1 0 150,921 17.40% 41.30% 58.70% 0.00% 0.00% 358,318 509,239 0 0
MapMap2015 704,913 2 1 3 176,529 25.04% 36.43% 61.47% 2.11% 0.00% 256,766 433,295 14,852 0
Map2011 866,977 2 1 3 141,204 16.29% 40.63% 56.91% 2.46% 0.00% 352,213 493,417 21,347 0
Map2007 727,531 2 1 0 62,498 8.59% 42.43% 51.02% 0.00% 6.55% 308,693 371,191 0 47,647
Map2003 853,609 1 2 0 290,186 34.00% 66.11% 32.11% 0.00% 1.78% 564,283 274,097 0 15,229

Mississippi Results for 2015

Login

Terms of Use - DCMA Policy - Privacy Policy and Cookies


© Dave Leip's Atlas of U.S. Elections, LLC 2019 All Rights Reserved