| Map | Pie | Office | Total | D | R | I | Margin | %Margin | Dem | Rep | Ind | Oth. | Dem | Rep | Ind | Other | | | | | | | | | | | | | | | | | | |
|---|
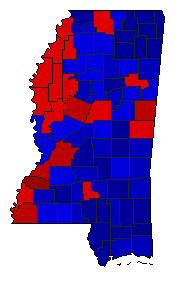
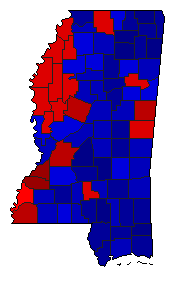
 |  | Governor |
718,185 |
2 |
1 |
0 |
245,054 |
34.12% |
32.25% |
66.38% |
0.00% |
1.37% |
231,643 |
476,697 |
0 |
9,845 |
 |  | Lt. Governor |
711,283 |
2 |
1 |
3 |
174,333 |
24.51% |
35.94% |
60.45% |
2.28% |
1.32% |
255,657 |
429,990 |
16,226 |
9,410 |
 |  | Secretary of State |
710,785 |
2 |
1 |
3 |
183,006 |
25.75% |
35.64% |
61.38% |
2.98% |
0.00% |
253,307 |
436,313 |
21,165 |
0 |
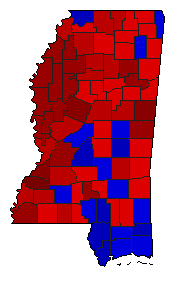
 |  | State Treasurer |
645,479 |
0 |
1 |
2 |
377,451 |
58.48% |
0.00% |
79.24% |
20.76% |
0.00% |
0 |
511,465 |
134,014 |
0 |
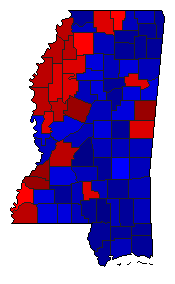
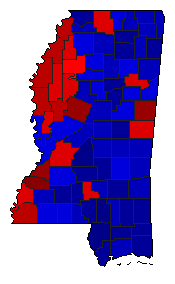
 |  | Attorney General |
716,161 |
1 |
2 |
0 |
75,777 |
10.58% |
55.29% |
44.71% |
0.00% |
0.00% |
395,969 |
320,192 |
0 |
0 |
 |  | State Auditor |
708,880 |
2 |
1 |
3 |
207,702 |
29.30% |
34.69% |
63.99% |
1.32% |
0.00% |
245,899 |
453,601 |
9,380 |
0 |
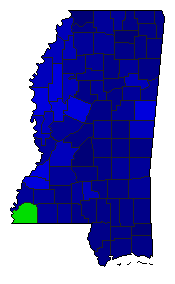
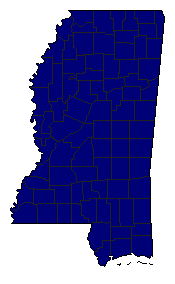 |  | Insurance Commissioner |
585,257 |
0 |
1 |
0 |
585,257 |
100.00% |
0.00% |
100.00% |
0.00% |
0.00% |
0 |
585,257 |
0 |
0 |
 |  | Agriculture Commissioner |
704,913 |
2 |
1 |
3 |
176,529 |
25.04% |
36.43% |
61.47% |
2.11% |
0.00% |
256,766 |
433,295 |
14,852 |
0 |
|
