| Map | Pie | Office | Total | D | R | I | Margin | %Margin | Dem | Rep | Ind | Oth. | Dem | Rep | Ind | Other | | | | | | | | | | | | | | | | | | |
|---|
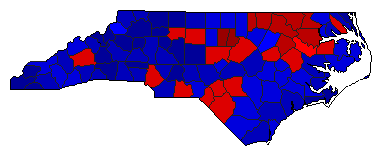
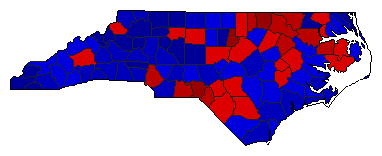
 |  | President |
4,741,564 |
2 |
1 |
0 |
173,315 |
3.66% |
46.17% |
49.83% |
0.00% |
4.00% |
2,189,316 |
2,362,631 |
0 |
189,617 |
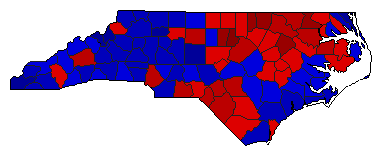
 |  | Senator |
4,691,133 |
2 |
1 |
0 |
267,211 |
5.70% |
45.37% |
51.06% |
0.00% |
3.57% |
2,128,165 |
2,395,376 |
0 |
167,592 |
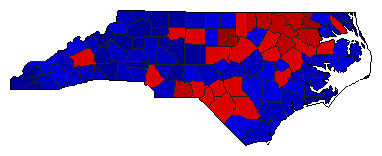
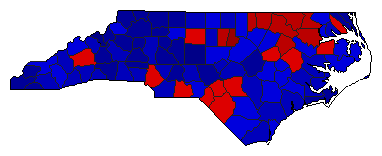
 |  | Governor |
4,711,014 |
1 |
2 |
0 |
10,277 |
0.22% |
49.02% |
48.80% |
0.00% |
2.19% |
2,309,157 |
2,298,880 |
0 |
102,977 |
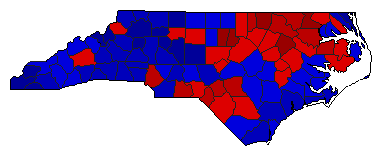
 |  | Lt. Governor |
4,619,680 |
2 |
1 |
0 |
300,128 |
6.50% |
45.32% |
51.81% |
0.00% |
2.87% |
2,093,449 |
2,393,577 |
0 |
132,654 |
 |  | Secretary of State |
4,531,425 |
1 |
2 |
0 |
204,951 |
4.52% |
52.26% |
47.74% |
0.00% |
0.00% |
2,368,188 |
2,163,237 |
0 |
0 |
 |  | State Treasurer |
4,502,784 |
2 |
1 |
0 |
243,260 |
5.40% |
47.30% |
52.70% |
0.00% |
0.00% |
2,129,762 |
2,373,022 |
0 |
0 |
 |  | Attorney General |
4,582,757 |
1 |
2 |
0 |
24,605 |
0.54% |
50.27% |
49.73% |
0.00% |
0.00% |
2,303,681 |
2,279,076 |
0 |
0 |
 |  | State Auditor |
4,512,830 |
1 |
2 |
0 |
6,042 |
0.13% |
50.07% |
49.93% |
0.00% |
0.00% |
2,259,436 |
2,253,394 |
0 |
0 |
 |  | Insurance Commissioner |
4,505,794 |
2 |
1 |
0 |
35,888 |
0.80% |
49.60% |
50.40% |
0.00% |
0.00% |
2,234,953 |
2,270,841 |
0 |
0 |
 |  | Agriculture Commissioner |
4,543,317 |
2 |
1 |
0 |
505,573 |
11.13% |
44.44% |
55.56% |
0.00% |
0.00% |
2,018,872 |
2,524,445 |
0 |
0 |
| | | Map | Pie | Initiative | Total Vote | N | | Y | Margin | %Margin | No | | Yes | Oth. | No | | Yes | |
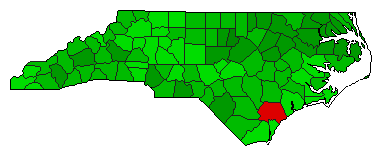 |  | Referendum |
2,164,958 |
2 |
0 |
1 |
674,690 |
31.16% |
34.42% |
0.00% |
65.58% |
0.00% |
745,134 |
0 |
1,419,824 |
0 |
|
