2000 Presidential Republican Primary Election Data Graphs - Michigan
Note: The Google advertisement links below may advocate political positions that this site does not endorse.
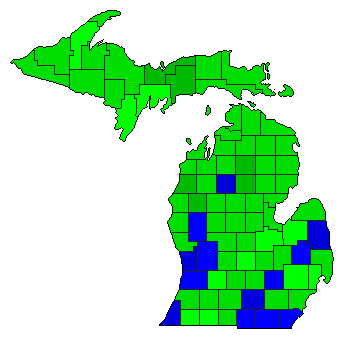
Map

AlconaKeyes2.6%
 
Bush42.3%
 
McCain54.4%
 
Other0.7%


AlgerKeyes2.5%
 
Bush36.8%
 
McCain60.2%
 
Other0.5%


AlleganKeyes7.2%
 
Bush47.3%
 
McCain44.9%
 
Other0.7%


AlpenaKeyes2.5%
 
Bush42.6%
 
McCain53.7%
 
Other1.3%


AntrimKeyes3.0%
 
Bush43.2%
 
McCain52.4%
 
Other1.3%


ArenacKeyes2.7%
 
Bush40.6%
 
McCain55.8%
 
Other0.9%


BaragaKeyes7.2%
 
Bush41.9%
 
McCain50.3%
 
Other0.6%


BarryKeyes6.9%
 
Bush42.9%
 
McCain49.4%
 
Other0.8%


BayKeyes3.1%
 
Bush40.7%
 
McCain54.5%
 
Other1.7%


BenzieKeyes2.4%
 
Bush38.0%
 
McCain58.9%
 
Other0.7%


BerrienKeyes2.8%
 
Bush50.1%
 
McCain45.6%
 
Other1.6%


BranchKeyes3.4%
 
Bush45.1%
 
McCain50.8%
 
Other0.8%


CalhounKeyes5.6%
 
Bush41.1%
 
McCain52.5%
 
Other0.7%


CassKeyes3.0%
 
Bush46.0%
 
McCain50.0%
 
Other1.1%


CharlevoixKeyes2.8%
 
Bush40.4%
 
McCain56.1%
 
Other0.7%


CheboyganKeyes2.2%
 
Bush39.0%
 
McCain57.8%
 
Other1.0%


ChippewaKeyes2.6%
 
Bush37.8%
 
McCain58.6%
 
Other1.0%


ClareKeyes2.5%
 
Bush37.8%
 
McCain58.9%
 
Other0.8%


ClintonKeyes3.6%
 
Bush46.4%
 
McCain49.4%
 
Other0.7%


CrawfordKeyes2.5%
 
Bush34.5%
 
McCain61.9%
 
Other1.1%


DeltaKeyes4.6%
 
Bush44.4%
 
McCain50.0%
 
Other1.1%


DickinsonKeyes3.6%
 
Bush43.4%
 
McCain52.2%
 
Other0.9%


EatonKeyes3.8%
 
Bush43.0%
 
McCain52.0%
 
Other1.2%


EmmetKeyes3.4%
 
Bush43.4%
 
McCain52.7%
 
Other0.5%


GeneseeKeyes4.7%
 
Bush39.4%
 
McCain54.8%
 
Other1.1%


GladwinKeyes3.9%
 
Bush40.2%
 
McCain55.2%
 
Other0.7%


GogebicKeyes3.3%
 
Bush37.0%
 
McCain58.6%
 
Other1.1%


Grand TraverseKeyes3.0%
 
Bush44.0%
 
McCain51.1%
 
Other2.0%


GratiotKeyes2.3%
 
Bush45.5%
 
McCain51.5%
 
Other0.7%


HillsdaleKeyes4.3%
 
Bush49.5%
 
McCain45.1%
 
Other1.1%


HoughtonKeyes6.2%
 
Bush45.8%
 
McCain47.4%
 
Other0.7%


HuronKeyes3.4%
 
Bush43.6%
 
McCain51.6%
 
Other1.3%


InghamKeyes3.5%
 
Bush38.7%
 
McCain56.7%
 
Other1.1%


IoniaKeyes6.4%
 
Bush42.2%
 
McCain50.2%
 
Other1.2%


IoscoKeyes2.9%
 
Bush36.9%
 
McCain58.4%
 
Other1.7%


IronKeyes3.5%
 
Bush35.4%
 
McCain59.5%
 
Other1.6%


IsabellaKeyes4.0%
 
Bush37.1%
 
McCain57.9%
 
Other1.0%


JacksonKeyes3.8%
 
Bush51.1%
 
McCain44.3%
 
Other0.8%


KalamazooKeyes4.7%
 
Bush40.6%
 
McCain53.7%
 
Other1.0%


KalkaskaKeyes3.6%
 
Bush40.8%
 
McCain54.9%
 
Other0.8%


KentKeyes8.8%
 
Bush45.6%
 
McCain44.5%
 
Other1.1%


KeweenawKeyes7.1%
 
Bush39.4%
 
McCain51.5%
 
Other2.1%


LakeKeyes3.5%
 
Bush32.5%
 
McCain62.7%
 
Other1.3%


LapeerKeyes5.9%
 
Bush46.6%
 
McCain46.3%
 
Other1.2%


LeelanauKeyes2.4%
 
Bush41.8%
 
McCain54.9%
 
Other1.0%


LenaweeKeyes4.3%
 
Bush48.2%
 
McCain46.3%
 
Other1.1%


LivingstonKeyes4.6%
 
Bush48.2%
 
McCain45.8%
 
Other1.3%


LuceKeyes2.9%
 
Bush36.2%
 
McCain60.0%
 
Other0.9%


MackinacKeyes2.7%
 
Bush37.3%
 
McCain57.8%
 
Other2.3%


MacombKeyes3.5%
 
Bush45.1%
 
McCain49.7%
 
Other1.8%


ManisteeKeyes2.2%
 
Bush34.4%
 
McCain62.6%
 
Other0.7%


MarquetteKeyes3.3%
 
Bush38.8%
 
McCain56.4%
 
Other1.4%


MasonKeyes2.6%
 
Bush42.2%
 
McCain53.7%
 
Other1.5%


MecostaKeyes3.3%
 
Bush40.2%
 
McCain55.7%
 
Other0.8%


MenomineeKeyes3.2%
 
Bush45.8%
 
McCain49.8%
 
Other1.3%


MidlandKeyes4.0%
 
Bush44.8%
 
McCain50.3%
 
Other1.0%


MissaukeeKeyes3.6%
 
Bush51.8%
 
McCain43.8%
 
Other0.8%


MonroeKeyes3.8%
 
Bush47.2%
 
McCain46.7%
 
Other2.3%


MontcalmKeyes5.4%
 
Bush40.8%
 
McCain52.9%
 
Other1.0%


MontmorencyKeyes3.3%
 
Bush38.3%
 
McCain56.9%
 
Other1.5%


MuskegonKeyes4.2%
 
Bush42.9%
 
McCain51.7%
 
Other1.2%


NewaygoKeyes5.1%
 
Bush47.1%
 
McCain46.6%
 
Other1.1%


OaklandKeyes3.8%
 
Bush45.0%
 
McCain49.5%
 
Other1.7%


OceanaKeyes3.4%
 
Bush41.4%
 
McCain53.8%
 
Other1.3%


OgemawKeyes3.2%
 
Bush36.4%
 
McCain59.5%
 
Other1.0%


OntonagonKeyes2.8%
 
Bush37.9%
 
McCain57.3%
 
Other2.0%


OsceolaKeyes2.6%
 
Bush43.6%
 
McCain53.4%
 
Other0.5%


OscodaKeyes3.3%
 
Bush37.3%
 
McCain58.5%
 
Other0.9%


OtsegoKeyes2.5%
 
Bush42.1%
 
McCain54.8%
 
Other0.6%


OttawaKeyes8.1%
 
Bush54.6%
 
McCain36.6%
 
Other0.8%


Presque IsleKeyes2.6%
 
Bush38.7%
 
McCain57.3%
 
Other1.4%


RoscommonKeyes1.6%
 
Bush35.1%
 
McCain62.4%
 
Other0.8%


SaginawKeyes3.4%
 
Bush46.4%
 
McCain49.5%
 
Other0.7%


St. ClairKeyes3.6%
 
Bush43.4%
 
McCain51.3%
 
Other1.7%


St. JosephKeyes4.0%
 
Bush45.4%
 
McCain49.6%
 
Other0.9%


SanilacKeyes4.0%
 
Bush51.6%
 
McCain43.5%
 
Other0.9%


SchoolcraftKeyes2.2%
 
Bush34.8%
 
McCain60.9%
 
Other2.1%


ShiawasseeKeyes3.8%
 
Bush43.9%
 
McCain51.3%
 
Other1.0%


TuscolaKeyes4.2%
 
Bush45.0%
 
McCain49.8%
 
Other1.0%


Van BurenKeyes4.9%
 
Bush38.7%
 
McCain55.5%
 
Other0.9%


WashtenawKeyes4.1%
 
Bush35.1%
 
McCain59.9%
 
Other1.0%


WayneKeyes5.1%
 
Bush37.1%
 
McCain55.9%
 
Other1.9%


WexfordKeyes3.0%
 
Bush40.0%
 
McCain56.2%
 
Other0.8%


National DataGraph for 2000 - Michigan Results for 2000

Login

Terms of Use - DCMA Policy - Privacy Policy and Cookies


© Dave Leip's Atlas of U.S. Elections, LLC 2019 All Rights Reserved