2002 Lt. Gubernatorial General Election Data Graphs - Oklahoma
Note: The Google advertisement links below may advocate political positions that this site does not endorse.
Data for this Contest was Contributed by on 2007-02-24
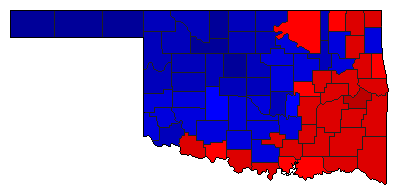
Map

AdairBoyd49.2%
 
Fallin44.3%
 
Other6.5%


AlfalfaBoyd25.2%
 
Fallin70.9%
 
Other3.9%


AtokaBoyd53.2%
 
Fallin42.6%
 
Other4.3%


BeaverBoyd22.3%
 
Fallin74.3%
 
Other3.4%


BeckhamBoyd38.2%
 
Fallin58.0%
 
Other3.8%


BlaineBoyd32.9%
 
Fallin63.2%
 
Other4.0%


BryanBoyd49.5%
 
Fallin47.1%
 
Other3.4%


CaddoBoyd47.1%
 
Fallin48.2%
 
Other4.7%


CanadianBoyd27.1%
 
Fallin68.9%
 
Other4.0%


CarterBoyd43.7%
 
Fallin52.8%
 
Other3.4%


CherokeeBoyd53.7%
 
Fallin40.1%
 
Other6.2%


ChoctawBoyd57.4%
 
Fallin38.6%
 
Other4.0%


CimarronBoyd22.7%
 
Fallin72.8%
 
Other4.5%


ClevelandBoyd38.8%
 
Fallin57.5%
 
Other3.7%


CoalBoyd58.7%
 
Fallin37.3%
 
Other4.0%


ComancheBoyd40.3%
 
Fallin56.0%
 
Other3.7%


CottonBoyd47.5%
 
Fallin47.4%
 
Other5.1%


CraigBoyd51.9%
 
Fallin42.7%
 
Other5.4%


CreekBoyd42.3%
 
Fallin51.5%
 
Other6.2%


CusterBoyd33.2%
 
Fallin63.1%
 
Other3.7%


DelawareBoyd44.1%
 
Fallin50.5%
 
Other5.4%


DeweyBoyd31.3%
 
Fallin63.8%
 
Other4.9%


EllisBoyd30.2%
 
Fallin65.0%
 
Other4.8%


GarfieldBoyd29.0%
 
Fallin66.8%
 
Other4.2%


GarvinBoyd43.8%
 
Fallin51.7%
 
Other4.5%


GradyBoyd38.3%
 
Fallin57.1%
 
Other4.5%


GrantBoyd33.0%
 
Fallin61.5%
 
Other5.5%


GreerBoyd44.0%
 
Fallin51.4%
 
Other4.6%


HarmonBoyd45.0%
 
Fallin51.7%
 
Other3.3%


HarperBoyd27.8%
 
Fallin68.7%
 
Other3.5%


HaskellBoyd60.1%
 
Fallin35.0%
 
Other4.9%


HughesBoyd52.0%
 
Fallin43.9%
 
Other4.1%


JacksonBoyd33.4%
 
Fallin63.5%
 
Other3.1%


JeffersonBoyd51.1%
 
Fallin45.1%
 
Other3.8%


JohnstonBoyd53.2%
 
Fallin43.0%
 
Other3.8%


KayBoyd33.7%
 
Fallin61.4%
 
Other4.9%


KingfisherBoyd22.3%
 
Fallin74.3%
 
Other3.4%


KiowaBoyd45.8%
 
Fallin50.2%
 
Other4.0%


LatimerBoyd60.0%
 
Fallin34.5%
 
Other5.5%


Le FloreBoyd53.4%
 
Fallin42.8%
 
Other3.8%


LincolnBoyd34.8%
 
Fallin59.7%
 
Other5.5%


LoganBoyd30.4%
 
Fallin65.4%
 
Other4.2%


LoveBoyd50.2%
 
Fallin46.2%
 
Other3.6%


McClainBoyd37.6%
 
Fallin58.0%
 
Other4.4%


McCurtainBoyd57.0%
 
Fallin38.5%
 
Other4.5%


McIntoshBoyd56.3%
 
Fallin38.0%
 
Other5.7%


MajorBoyd22.6%
 
Fallin73.6%
 
Other3.8%


MarshallBoyd48.4%
 
Fallin48.2%
 
Other3.4%


MayesBoyd51.0%
 
Fallin44.2%
 
Other4.8%


MurrayBoyd50.2%
 
Fallin46.0%
 
Other3.7%


MuskogeeBoyd52.4%
 
Fallin42.9%
 
Other4.6%


NobleBoyd31.0%
 
Fallin64.2%
 
Other4.8%


NowataBoyd47.4%
 
Fallin47.0%
 
Other5.5%


OkfuskeeBoyd49.2%
 
Fallin45.0%
 
Other5.9%


OklahomaBoyd33.6%
 
Fallin62.7%
 
Other3.7%


OkmulgeeBoyd54.2%
 
Fallin40.7%
 
Other5.1%


OsageBoyd47.9%
 
Fallin47.0%
 
Other5.0%


OttawaBoyd52.9%
 
Fallin41.8%
 
Other5.3%


PawneeBoyd41.5%
 
Fallin53.2%
 
Other5.3%


PayneBoyd36.0%
 
Fallin59.7%
 
Other4.2%


PittsburgBoyd54.1%
 
Fallin40.7%
 
Other5.2%


PontotocBoyd43.5%
 
Fallin52.6%
 
Other3.8%


PottawatomieBoyd35.3%
 
Fallin60.7%
 
Other4.0%


PushmatahaBoyd55.2%
 
Fallin39.4%
 
Other5.4%


Roger MillsBoyd34.1%
 
Fallin60.9%
 
Other5.0%


RogersBoyd40.7%
 
Fallin54.8%
 
Other4.5%


SeminoleBoyd47.3%
 
Fallin48.9%
 
Other3.8%


SequoyahBoyd52.6%
 
Fallin41.9%
 
Other5.5%


StephensBoyd38.3%
 
Fallin58.1%
 
Other3.6%


TexasBoyd21.1%
 
Fallin75.7%
 
Other3.2%


TillmanBoyd50.4%
 
Fallin46.7%
 
Other3.0%


TulsaBoyd34.9%
 
Fallin61.5%
 
Other3.7%


WagonerBoyd40.8%
 
Fallin54.6%
 
Other4.7%


WashingtonBoyd32.4%
 
Fallin63.1%
 
Other4.5%


WashitaBoyd36.8%
 
Fallin58.7%
 
Other4.5%


WoodsBoyd29.0%
 
Fallin67.0%
 
Other4.0%


WoodwardBoyd28.3%
 
Fallin68.3%
 
Other3.4%


National DataGraph for 2002 - Oklahoma Results for 2002

Login

Terms of Use - DCMA Policy - Privacy Policy and Cookies


© Dave Leip's Atlas of U.S. Elections, LLC 2019 All Rights Reserved