1966 Senatorial General Election Data Graphs - Illinois
Note: The Google advertisement links below may advocate political positions that this site does not endorse.
Data for this Contest was Contributed by on 2009-12-15
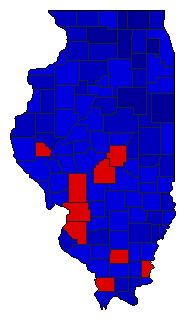
Map

AdamsDouglas43.9%
 
Percy55.7%
 
Other0.4%


AlexanderDouglas49.2%
 
Percy50.8%


BondDouglas44.4%
 
Percy55.6%


BooneDouglas29.0%
 
Percy70.8%
 
Other0.3%


BrownDouglas51.2%
 
Percy48.8%


BureauDouglas36.5%
 
Percy63.5%


CalhounDouglas47.5%
 
Percy52.5%
 
Other0.0%


CarrollDouglas31.0%
 
Percy69.0%


CassDouglas48.7%
 
Percy51.3%


ChampaignDouglas35.9%
 
Percy63.0%
 
Other1.1%


ChristianDouglas54.6%
 
Percy45.4%


ClarkDouglas41.0%
 
Percy59.0%


ClayDouglas43.5%
 
Percy56.5%


ClintonDouglas43.4%
 
Percy56.6%


ColesDouglas44.0%
 
Percy55.4%
 
Other0.6%


CookDouglas47.2%
 
Percy51.2%
 
Other1.6%


CrawfordDouglas40.0%
 
Percy60.0%


CumberlandDouglas46.1%
 
Percy53.9%


DeKalbDouglas28.3%
 
Percy71.3%
 
Other0.3%


De WittDouglas41.2%
 
Percy58.2%
 
Other0.6%


DouglasDouglas39.0%
 
Percy60.6%
 
Other0.5%


DuPageDouglas23.7%
 
Percy76.3%


EdgarDouglas38.4%
 
Percy60.6%
 
Other1.1%


EdwardsDouglas33.6%
 
Percy66.4%


EffinghamDouglas42.3%
 
Percy57.0%
 
Other0.7%


FayetteDouglas45.5%
 
Percy54.5%


FordDouglas31.6%
 
Percy68.4%


FranklinDouglas54.2%
 
Percy45.8%


FultonDouglas48.2%
 
Percy51.8%


GallatinDouglas51.9%
 
Percy48.1%


GreeneDouglas46.2%
 
Percy53.8%


GrundyDouglas33.0%
 
Percy66.6%
 
Other0.4%


HamiltonDouglas41.6%
 
Percy58.4%


HancockDouglas38.9%
 
Percy60.9%
 
Other0.2%


HardinDouglas46.5%
 
Percy53.5%


HendersonDouglas40.6%
 
Percy59.4%


HenryDouglas40.0%
 
Percy60.0%


IroquoisDouglas28.1%
 
Percy71.4%
 
Other0.5%


JacksonDouglas49.0%
 
Percy51.0%


JasperDouglas44.6%
 
Percy55.0%
 
Other0.4%


JeffersonDouglas46.8%
 
Percy53.2%


JerseyDouglas48.8%
 
Percy51.2%


Jo DaviessDouglas35.2%
 
Percy64.8%


JohnsonDouglas35.8%
 
Percy64.2%


KaneDouglas31.7%
 
Percy68.3%


KankakeeDouglas39.4%
 
Percy59.8%
 
Other0.7%


KendallDouglas24.0%
 
Percy76.0%


KnoxDouglas44.4%
 
Percy55.4%
 
Other0.2%


LakeDouglas29.4%
 
Percy62.1%
 
Other8.5%


LaSalleDouglas42.5%
 
Percy57.2%
 
Other0.2%


LawrenceDouglas40.6%
 
Percy59.4%


LeeDouglas33.6%
 
Percy66.1%
 
Other0.3%


LivingstonDouglas27.1%
 
Percy72.9%


LoganDouglas41.3%
 
Percy58.7%


McDonoughDouglas31.8%
 
Percy68.0%
 
Other0.3%


McHenryDouglas27.2%
 
Percy72.8%


McLeanDouglas33.1%
 
Percy66.5%
 
Other0.3%


MaconDouglas50.5%
 
Percy49.5%


MacoupinDouglas51.8%
 
Percy48.0%
 
Other0.2%


MadisonDouglas52.6%
 
Percy47.2%
 
Other0.2%


MarionDouglas47.4%
 
Percy52.6%


MarshallDouglas40.6%
 
Percy59.4%


MasonDouglas46.2%
 
Percy53.8%
 
Other0.1%


MassacDouglas39.0%
 
Percy60.9%
 
Other0.1%


MenardDouglas41.4%
 
Percy58.4%
 
Other0.2%


MercerDouglas39.6%
 
Percy60.2%
 
Other0.2%


MonroeDouglas38.8%
 
Percy61.2%


MontgomeryDouglas49.6%
 
Percy50.4%


MorganDouglas41.7%
 
Percy58.3%


MoultrieDouglas45.0%
 
Percy55.0%


OgleDouglas25.4%
 
Percy74.0%
 
Other0.6%


PeoriaDouglas43.2%
 
Percy56.4%
 
Other0.4%


PerryDouglas46.5%
 
Percy53.5%


PiattDouglas37.9%
 
Percy61.2%
 
Other0.9%


PikeDouglas49.3%
 
Percy50.7%
 
Other0.0%


PopeDouglas37.3%
 
Percy62.7%


PulaskiDouglas47.6%
 
Percy52.4%


PutnamDouglas43.5%
 
Percy56.4%
 
Other0.2%


RandolphDouglas45.2%
 
Percy54.8%


RichlandDouglas38.4%
 
Percy61.3%
 
Other0.2%


Rock IslandDouglas48.7%
 
Percy51.3%


St. ClairDouglas54.6%
 
Percy45.4%
 
Other0.0%


SalineDouglas46.3%
 
Percy53.7%


SangamonDouglas44.6%
 
Percy54.5%
 
Other0.8%


SchuylerDouglas39.8%
 
Percy60.2%


ScottDouglas44.0%
 
Percy55.9%
 
Other0.1%


ShelbyDouglas48.1%
 
Percy51.9%


StarkDouglas37.3%
 
Percy62.7%


StephensonDouglas34.7%
 
Percy65.3%


TazewellDouglas47.2%
 
Percy52.8%


UnionDouglas52.1%
 
Percy47.9%


VermilionDouglas44.5%
 
Percy55.5%


WabashDouglas38.8%
 
Percy61.1%
 
Other0.1%


WarrenDouglas36.0%
 
Percy63.7%
 
Other0.2%


WashingtonDouglas34.6%
 
Percy65.4%


WayneDouglas37.6%
 
Percy62.4%


WhiteDouglas44.1%
 
Percy55.9%
 
Other0.0%


WhitesideDouglas33.0%
 
Percy67.0%


WillDouglas43.3%
 
Percy55.2%
 
Other1.6%


WilliamsonDouglas46.3%
 
Percy53.7%


WinnebagoDouglas38.8%
 
Percy59.9%
 
Other1.4%


WoodfordDouglas34.5%
 
Percy65.5%


National DataGraph for 1966 - Illinois Results for 1966

Login

Terms of Use - DCMA Policy - Privacy Policy and Cookies


© Dave Leip's Atlas of U.S. Elections, LLC 2019 All Rights Reserved