1966 Gubernatorial General Election Data Graphs - Pennsylvania
Note: The Google advertisement links below may advocate political positions that this site does not endorse.
Data for this Contest was Contributed by on 2014-04-27
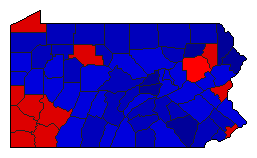
Map

AdamsShapp36.1%
 
Shafer62.4%
 
Other1.5%


AlleghenyShapp52.5%
 
Shafer46.4%
 
Other1.1%


ArmstrongShapp45.5%
 
Shafer53.4%
 
Other1.2%


BeaverShapp56.3%
 
Shafer42.6%
 
Other1.0%


BedfordShapp36.2%
 
Shafer63.0%
 
Other0.8%


BerksShapp46.6%
 
Shafer51.5%
 
Other1.9%


BlairShapp38.1%
 
Shafer59.6%
 
Other2.2%


BradfordShapp29.4%
 
Shafer69.7%
 
Other0.9%


BucksShapp40.0%
 
Shafer54.7%
 
Other5.3%


ButlerShapp40.6%
 
Shafer57.9%
 
Other1.5%


CambriaShapp48.0%
 
Shafer51.5%
 
Other0.5%


CameronShapp36.4%
 
Shafer62.4%
 
Other1.2%


CarbonShapp46.9%
 
Shafer51.8%
 
Other1.3%


CentreShapp38.7%
 
Shafer60.3%
 
Other1.0%


ChesterShapp31.5%
 
Shafer65.7%
 
Other2.8%


ClarionShapp39.9%
 
Shafer58.9%
 
Other1.2%


ClearfieldShapp44.7%
 
Shafer54.4%
 
Other1.0%


ClintonShapp42.8%
 
Shafer56.0%
 
Other1.2%


ColumbiaShapp39.5%
 
Shafer57.9%
 
Other2.6%


CrawfordShapp37.5%
 
Shafer60.6%
 
Other1.9%


CumberlandShapp31.4%
 
Shafer64.7%
 
Other3.9%


DauphinShapp30.2%
 
Shafer65.1%
 
Other4.7%


DelawareShapp33.7%
 
Shafer63.4%
 
Other2.9%


ElkShapp50.9%
 
Shafer48.6%
 
Other0.5%


ErieShapp52.0%
 
Shafer47.1%
 
Other0.9%


FayetteShapp57.5%
 
Shafer41.5%
 
Other1.0%


ForestShapp34.6%
 
Shafer64.7%
 
Other0.7%


FranklinShapp37.1%
 
Shafer59.1%
 
Other3.9%


FultonShapp45.4%
 
Shafer53.2%
 
Other1.4%


GreeneShapp55.8%
 
Shafer43.5%
 
Other0.7%


HuntingdonShapp35.4%
 
Shafer62.7%
 
Other1.9%


IndianaShapp40.5%
 
Shafer58.6%
 
Other0.9%


JeffersonShapp38.8%
 
Shafer60.4%
 
Other0.8%


JuniataShapp38.8%
 
Shafer59.6%
 
Other1.5%


LackawannaShapp50.3%
 
Shafer49.4%
 
Other0.3%


LancasterShapp26.5%
 
Shafer70.4%
 
Other3.1%


LawrenceShapp46.4%
 
Shafer53.3%
 
Other0.3%


LebanonShapp33.0%
 
Shafer64.1%
 
Other2.9%


LehighShapp43.0%
 
Shafer55.5%
 
Other1.5%


LuzerneShapp49.7%
 
Shafer47.6%
 
Other2.7%


LycomingShapp39.2%
 
Shafer57.5%
 
Other3.3%


McKeanShapp36.1%
 
Shafer63.3%
 
Other0.6%


MercerShapp46.5%
 
Shafer51.7%
 
Other1.8%


MifflinShapp38.6%
 
Shafer60.4%
 
Other1.0%


MonroeShapp40.4%
 
Shafer57.4%
 
Other2.2%


MontgomeryShapp33.1%
 
Shafer64.6%
 
Other2.3%


MontourShapp39.0%
 
Shafer59.5%
 
Other1.5%


NorthamptonShapp52.5%
 
Shafer46.0%
 
Other1.5%


NorthumberlandShapp39.9%
 
Shafer58.6%
 
Other1.6%


PerryShapp34.0%
 
Shafer62.0%
 
Other3.9%


PhiladelphiaShapp56.7%
 
Shafer41.8%
 
Other1.5%


PikeShapp27.2%
 
Shafer70.5%
 
Other2.3%


PotterShapp32.9%
 
Shafer66.4%
 
Other0.7%


SchuylkillShapp42.5%
 
Shafer56.8%
 
Other0.7%


SnyderShapp25.7%
 
Shafer71.7%
 
Other2.6%


SomersetShapp39.9%
 
Shafer59.4%
 
Other0.7%


SullivanShapp38.8%
 
Shafer60.2%
 
Other1.0%


SusquehannaShapp34.4%
 
Shafer64.7%
 
Other0.8%


TiogaShapp30.0%
 
Shafer69.5%
 
Other0.5%


UnionShapp25.0%
 
Shafer71.9%
 
Other3.1%


VenangoShapp37.9%
 
Shafer61.1%
 
Other1.0%


WarrenShapp38.3%
 
Shafer60.6%
 
Other1.0%


WashingtonShapp57.5%
 
Shafer41.5%
 
Other1.0%


WayneShapp27.5%
 
Shafer70.5%
 
Other2.0%


WestmorelandShapp56.2%
 
Shafer42.3%
 
Other1.5%


WyomingShapp27.3%
 
Shafer72.1%
 
Other0.6%


YorkShapp42.6%
 
Shafer55.6%
 
Other1.8%


National DataGraph for 1966 - Pennsylvania Results for 1966

Login

Terms of Use - DCMA Policy - Privacy Policy and Cookies


© Dave Leip's Atlas of U.S. Elections, LLC 2019 All Rights Reserved