1970 Senatorial General Election Data Graphs - Pennsylvania
Note: The Google advertisement links below may advocate political positions that this site does not endorse.
Data for this Contest was Contributed by on 2016-05-03
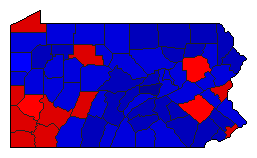
Map

AdamsSesler38.9%
 
Scott58.7%
 
Other2.4%


AlleghenySesler48.2%
 
Scott47.8%
 
Other3.9%


ArmstrongSesler44.5%
 
Scott54.2%
 
Other1.3%


BeaverSesler53.3%
 
Scott43.7%
 
Other3.0%


BedfordSesler37.4%
 
Scott60.6%
 
Other1.9%


BerksSesler49.3%
 
Scott46.1%
 
Other4.6%


BlairSesler41.5%
 
Scott51.9%
 
Other6.5%


BradfordSesler28.2%
 
Scott67.5%
 
Other4.3%


BucksSesler40.6%
 
Scott54.0%
 
Other5.4%


ButlerSesler45.0%
 
Scott51.2%
 
Other3.8%


CambriaSesler52.6%
 
Scott45.4%
 
Other2.0%


CameronSesler45.0%
 
Scott53.1%
 
Other1.9%


CarbonSesler45.0%
 
Scott52.9%
 
Other2.1%


CentreSesler35.4%
 
Scott62.4%
 
Other2.2%


ChesterSesler33.4%
 
Scott62.5%
 
Other4.1%


ClarionSesler40.9%
 
Scott57.3%
 
Other1.7%


ClearfieldSesler48.1%
 
Scott50.0%
 
Other1.9%


ClintonSesler44.7%
 
Scott53.5%
 
Other1.8%


ColumbiaSesler36.2%
 
Scott52.0%
 
Other11.8%


CrawfordSesler45.1%
 
Scott51.0%
 
Other3.9%


CumberlandSesler34.2%
 
Scott61.2%
 
Other4.6%


DauphinSesler33.5%
 
Scott62.0%
 
Other4.5%


DelawareSesler35.9%
 
Scott61.4%
 
Other2.7%


ElkSesler50.7%
 
Scott47.7%
 
Other1.6%


ErieSesler51.8%
 
Scott46.5%
 
Other1.7%


FayetteSesler59.9%
 
Scott38.4%
 
Other1.7%


ForestSesler37.7%
 
Scott61.5%
 
Other0.7%


FranklinSesler40.8%
 
Scott55.0%
 
Other4.2%


FultonSesler45.3%
 
Scott52.9%
 
Other1.8%


GreeneSesler59.4%
 
Scott39.0%
 
Other1.6%


HuntingdonSesler32.4%
 
Scott63.6%
 
Other4.0%


IndianaSesler42.2%
 
Scott56.2%
 
Other1.6%


JeffersonSesler39.7%
 
Scott58.8%
 
Other1.5%


JuniataSesler38.7%
 
Scott59.4%
 
Other1.9%


LackawannaSesler47.3%
 
Scott51.0%
 
Other1.7%


LancasterSesler29.6%
 
Scott65.5%
 
Other5.0%


LawrenceSesler46.4%
 
Scott51.3%
 
Other2.3%


LebanonSesler33.5%
 
Scott60.8%
 
Other5.7%


LehighSesler46.1%
 
Scott51.2%
 
Other2.7%


LuzerneSesler50.0%
 
Scott46.5%
 
Other3.5%


LycomingSesler38.0%
 
Scott57.2%
 
Other4.8%


McKeanSesler39.2%
 
Scott59.3%
 
Other1.5%


MercerSesler48.0%
 
Scott49.4%
 
Other2.6%


MifflinSesler35.5%
 
Scott62.0%
 
Other2.5%


MonroeSesler44.0%
 
Scott52.4%
 
Other3.6%


MontgomerySesler36.3%
 
Scott60.3%
 
Other3.4%


MontourSesler38.9%
 
Scott57.1%
 
Other4.0%


NorthamptonSesler53.0%
 
Scott44.6%
 
Other2.4%


NorthumberlandSesler38.7%
 
Scott58.4%
 
Other2.9%


PerrySesler34.0%
 
Scott62.6%
 
Other3.4%


PhiladelphiaSesler53.7%
 
Scott44.2%
 
Other2.1%


PikeSesler28.8%
 
Scott66.7%
 
Other4.4%


PotterSesler43.2%
 
Scott53.7%
 
Other3.1%


SchuylkillSesler43.7%
 
Scott53.3%
 
Other2.9%


SnyderSesler23.8%
 
Scott71.1%
 
Other5.1%


SomersetSesler42.8%
 
Scott55.7%
 
Other1.5%


SullivanSesler37.6%
 
Scott60.3%
 
Other2.1%


SusquehannaSesler29.9%
 
Scott62.2%
 
Other7.9%


TiogaSesler32.5%
 
Scott64.2%
 
Other3.3%


UnionSesler25.9%
 
Scott69.3%
 
Other4.8%


VenangoSesler38.4%
 
Scott60.2%
 
Other1.4%


WarrenSesler41.3%
 
Scott57.2%
 
Other1.5%


WashingtonSesler54.2%
 
Scott43.1%
 
Other2.7%


WayneSesler23.1%
 
Scott68.9%
 
Other8.1%


WestmorelandSesler54.6%
 
Scott42.4%
 
Other3.0%


WyomingSesler25.7%
 
Scott69.9%
 
Other4.4%


YorkSesler40.1%
 
Scott55.9%
 
Other4.0%


National DataGraph for 1970 - Pennsylvania Results for 1970

Login

Terms of Use - DCMA Policy - Privacy Policy and Cookies


© Dave Leip's Atlas of U.S. Elections, LLC 2019 All Rights Reserved