1972 Presidential General Election Data Graphs - Wisconsin
Note: The Google advertisement links below may advocate political positions that this site does not endorse.
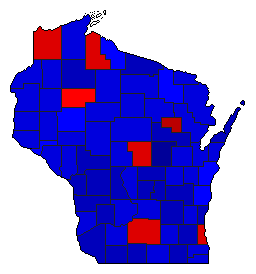
Map

AdamsMcGovern44.3%
 
Nixon53.2%
 
Other2.5%


AshlandMcGovern50.9%
 
Nixon46.9%
 
Other2.2%


BarronMcGovern38.3%
 
Nixon59.9%
 
Other1.8%


BayfieldMcGovern46.6%
 
Nixon51.9%
 
Other1.4%


BrownMcGovern40.4%
 
Nixon56.5%
 
Other3.1%


BuffaloMcGovern43.5%
 
Nixon54.4%
 
Other2.1%


BurnettMcGovern43.7%
 
Nixon54.4%
 
Other1.9%


CalumetMcGovern41.6%
 
Nixon55.8%
 
Other2.5%


ChippewaMcGovern47.9%
 
Nixon49.4%
 
Other2.7%


ClarkMcGovern36.5%
 
Nixon56.5%
 
Other7.0%


ColumbiaMcGovern40.6%
 
Nixon58.0%
 
Other1.4%


CrawfordMcGovern39.4%
 
Nixon58.7%
 
Other1.9%


DaneMcGovern58.1%
 
Nixon40.9%
 
Other1.1%


DodgeMcGovern35.7%
 
Nixon61.5%
 
Other2.8%


DoorMcGovern33.9%
 
Nixon64.3%
 
Other1.9%


DouglasMcGovern55.9%
 
Nixon42.6%
 
Other1.5%


DunnMcGovern45.2%
 
Nixon53.0%
 
Other1.7%


Eau ClaireMcGovern46.2%
 
Nixon51.3%
 
Other2.5%


FlorenceMcGovern42.1%
 
Nixon54.1%
 
Other3.8%


Fond du LacMcGovern35.0%
 
Nixon61.0%
 
Other4.0%


ForestMcGovern45.0%
 
Nixon49.8%
 
Other5.2%


GrantMcGovern36.3%
 
Nixon62.3%
 
Other1.4%


GreenMcGovern32.4%
 
Nixon66.1%
 
Other1.5%


Green LakeMcGovern29.2%
 
Nixon67.7%
 
Other3.2%


IowaMcGovern41.1%
 
Nixon57.5%
 
Other1.4%


IronMcGovern47.8%
 
Nixon49.9%
 
Other2.3%


JacksonMcGovern37.8%
 
Nixon60.8%
 
Other1.5%


JeffersonMcGovern37.8%
 
Nixon59.5%
 
Other2.7%


JuneauMcGovern36.7%
 
Nixon60.2%
 
Other3.2%


KenoshaMcGovern43.6%
 
Nixon53.9%
 
Other2.5%


KewauneeMcGovern40.0%
 
Nixon57.1%
 
Other2.9%


La CrosseMcGovern35.0%
 
Nixon63.3%
 
Other1.7%


LafayetteMcGovern36.0%
 
Nixon62.9%
 
Other1.1%


LangladeMcGovern39.5%
 
Nixon57.3%
 
Other3.3%


LincolnMcGovern38.5%
 
Nixon57.3%
 
Other4.2%


ManitowocMcGovern48.2%
 
Nixon48.5%
 
Other3.3%


MarathonMcGovern44.2%
 
Nixon51.3%
 
Other4.5%


MarinetteMcGovern38.7%
 
Nixon57.4%
 
Other3.9%


MarquetteMcGovern35.9%
 
Nixon62.6%
 
Other1.5%


MenomineeMcGovern62.3%
 
Nixon36.4%
 
Other1.3%


MilwaukeeMcGovern50.6%
 
Nixon46.0%
 
Other3.4%


MonroeMcGovern31.8%
 
Nixon66.7%
 
Other1.5%


OcontoMcGovern36.9%
 
Nixon59.4%
 
Other3.8%


OneidaMcGovern36.8%
 
Nixon58.8%
 
Other4.4%


OutagamieMcGovern37.9%
 
Nixon59.8%
 
Other2.2%


OzaukeeMcGovern33.4%
 
Nixon61.9%
 
Other4.7%


PepinMcGovern47.6%
 
Nixon49.3%
 
Other3.1%


PierceMcGovern47.9%
 
Nixon50.3%
 
Other1.8%


PolkMcGovern45.8%
 
Nixon52.4%
 
Other1.8%


PortageMcGovern58.1%
 
Nixon40.0%
 
Other1.8%


PriceMcGovern41.7%
 
Nixon54.4%
 
Other3.9%


RacineMcGovern40.7%
 
Nixon56.4%
 
Other2.9%


RichlandMcGovern32.6%
 
Nixon66.1%
 
Other1.3%


RockMcGovern40.2%
 
Nixon58.0%
 
Other1.8%


RuskMcGovern49.0%
 
Nixon47.9%
 
Other3.1%


St. CroixMcGovern46.0%
 
Nixon52.5%
 
Other1.5%


SaukMcGovern39.9%
 
Nixon58.8%
 
Other1.3%


SawyerMcGovern35.8%
 
Nixon62.5%
 
Other1.7%


ShawanoMcGovern30.0%
 
Nixon67.0%
 
Other3.0%


SheboyganMcGovern48.5%
 
Nixon49.4%
 
Other2.1%


TaylorMcGovern39.7%
 
Nixon55.9%
 
Other4.4%


TrempealeauMcGovern41.9%
 
Nixon56.7%
 
Other1.4%


VernonMcGovern32.8%
 
Nixon65.8%
 
Other1.4%


VilasMcGovern28.4%
 
Nixon65.9%
 
Other5.6%


WalworthMcGovern31.9%
 
Nixon66.1%
 
Other2.0%


WashburnMcGovern41.2%
 
Nixon56.8%
 
Other1.9%


WashingtonMcGovern38.6%
 
Nixon56.8%
 
Other4.6%


WaukeshaMcGovern35.4%
 
Nixon60.8%
 
Other3.7%


WaupacaMcGovern28.1%
 
Nixon70.1%
 
Other1.8%


WausharaMcGovern31.1%
 
Nixon66.3%
 
Other2.7%


WinnebagoMcGovern39.7%
 
Nixon57.3%
 
Other3.0%


WoodMcGovern38.6%
 
Nixon54.9%
 
Other6.5%


National DataGraph for 1972 - Wisconsin Results for 1972

Login

Terms of Use - DCMA Policy - Privacy Policy and Cookies


© Dave Leip's Atlas of U.S. Elections, LLC 2019 All Rights Reserved