1986 State Treasurer General Election Data Graphs - Illinois
Note: The Google advertisement links below may advocate political positions that this site does not endorse.
Data for this Contest was Contributed by on 2009-12-16
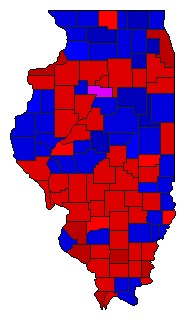
Map

AdamsCosentino47.5%
 
Houston50.6%
 
Other1.9%


AlexanderCosentino65.1%
 
Houston32.3%
 
Other2.6%


BondCosentino50.5%
 
Houston47.4%
 
Other2.1%


BooneCosentino39.2%
 
Houston57.6%
 
Other3.2%


BrownCosentino46.8%
 
Houston50.9%
 
Other2.3%


BureauCosentino54.1%
 
Houston43.6%
 
Other2.3%


CalhounCosentino55.8%
 
Houston41.0%
 
Other3.3%


CarrollCosentino42.2%
 
Houston54.3%
 
Other3.5%


CassCosentino49.4%
 
Houston48.4%
 
Other2.1%


ChampaignCosentino45.5%
 
Houston51.1%
 
Other3.4%


ChristianCosentino57.4%
 
Houston41.4%
 
Other1.2%


ClarkCosentino44.7%
 
Houston51.9%
 
Other3.4%


ClayCosentino50.6%
 
Houston46.7%
 
Other2.7%


ClintonCosentino49.6%
 
Houston48.2%
 
Other2.3%


ColesCosentino50.3%
 
Houston47.1%
 
Other2.6%


CookCosentino66.7%
 
Houston30.4%
 
Other2.9%


CrawfordCosentino42.5%
 
Houston54.4%
 
Other3.1%


CumberlandCosentino48.0%
 
Houston48.5%
 
Other3.4%


DeKalbCosentino42.7%
 
Houston53.0%
 
Other4.4%


De WittCosentino41.2%
 
Houston55.6%
 
Other3.2%


DouglasCosentino49.7%
 
Houston48.0%
 
Other2.2%


DuPageCosentino36.2%
 
Houston60.6%
 
Other3.2%


EdgarCosentino46.4%
 
Houston51.7%
 
Other1.9%


EdwardsCosentino39.1%
 
Houston58.3%
 
Other2.6%


EffinghamCosentino51.9%
 
Houston46.0%
 
Other2.1%


FayetteCosentino51.0%
 
Houston48.0%
 
Other1.0%


FordCosentino34.1%
 
Houston63.3%
 
Other2.6%


FranklinCosentino67.6%
 
Houston30.6%
 
Other1.8%


FultonCosentino59.3%
 
Houston38.5%
 
Other2.2%


GallatinCosentino64.0%
 
Houston31.4%
 
Other4.6%


GreeneCosentino51.0%
 
Houston45.9%
 
Other3.1%


GrundyCosentino50.6%
 
Houston46.8%
 
Other2.5%


HamiltonCosentino53.8%
 
Houston44.6%
 
Other1.6%


HancockCosentino40.6%
 
Houston56.1%
 
Other3.2%


HardinCosentino53.2%
 
Houston45.1%
 
Other1.7%


HendersonCosentino48.2%
 
Houston48.7%
 
Other3.1%


HenryCosentino53.0%
 
Houston44.3%
 
Other2.7%


IroquoisCosentino37.4%
 
Houston59.8%
 
Other2.8%


JacksonCosentino55.5%
 
Houston41.4%
 
Other3.1%


JasperCosentino51.5%
 
Houston45.5%
 
Other3.0%


JeffersonCosentino59.1%
 
Houston39.2%
 
Other1.7%


JerseyCosentino51.5%
 
Houston45.5%
 
Other3.0%


Jo DaviessCosentino41.3%
 
Houston54.2%
 
Other4.5%


JohnsonCosentino42.0%
 
Houston56.2%
 
Other1.8%


KaneCosentino40.5%
 
Houston55.9%
 
Other3.6%


KankakeeCosentino50.1%
 
Houston46.5%
 
Other3.4%


KendallCosentino34.4%
 
Houston62.4%
 
Other3.2%


KnoxCosentino50.2%
 
Houston46.5%
 
Other3.4%


LakeCosentino40.7%
 
Houston54.9%
 
Other4.4%


LaSalleCosentino54.2%
 
Houston42.9%
 
Other2.9%


LawrenceCosentino49.4%
 
Houston47.5%
 
Other3.1%


LeeCosentino43.6%
 
Houston54.0%
 
Other2.4%


LivingstonCosentino34.7%
 
Houston62.7%
 
Other2.5%


LoganCosentino36.4%
 
Houston61.8%
 
Other1.8%


McDonoughCosentino40.1%
 
Houston56.1%
 
Other3.9%


McHenryCosentino32.0%
 
Houston64.1%
 
Other3.9%


McLeanCosentino40.9%
 
Houston56.3%
 
Other2.8%


MaconCosentino56.8%
 
Houston41.6%
 
Other1.6%


MacoupinCosentino59.6%
 
Houston37.9%
 
Other2.4%


MadisonCosentino57.9%
 
Houston38.7%
 
Other3.4%


MarionCosentino54.8%
 
Houston43.1%
 
Other2.1%


MarshallCosentino48.6%
 
Houston48.6%
 
Other2.9%


MasonCosentino55.3%
 
Houston42.3%
 
Other2.3%


MassacCosentino47.0%
 
Houston50.1%
 
Other3.0%


MenardCosentino42.2%
 
Houston56.4%
 
Other1.4%


MercerCosentino52.3%
 
Houston45.1%
 
Other2.6%


MonroeCosentino42.9%
 
Houston54.9%
 
Other2.2%


MontgomeryCosentino54.7%
 
Houston43.8%
 
Other1.6%


MorganCosentino39.8%
 
Houston58.6%
 
Other1.6%


MoultrieCosentino53.0%
 
Houston44.5%
 
Other2.5%


OgleCosentino35.8%
 
Houston60.8%
 
Other3.4%


PeoriaCosentino53.8%
 
Houston43.7%
 
Other2.5%


PerryCosentino57.2%
 
Houston41.0%
 
Other1.8%


PiattCosentino48.0%
 
Houston49.5%
 
Other2.5%


PikeCosentino52.9%
 
Houston45.2%
 
Other2.0%


PopeCosentino43.1%
 
Houston53.9%
 
Other3.0%


PulaskiCosentino50.2%
 
Houston47.4%
 
Other2.4%


PutnamCosentino59.2%
 
Houston37.9%
 
Other2.9%


RandolphCosentino61.2%
 
Houston37.0%
 
Other1.9%


RichlandCosentino43.4%
 
Houston53.2%
 
Other3.4%


Rock IslandCosentino60.5%
 
Houston36.5%
 
Other3.0%


St. ClairCosentino60.3%
 
Houston37.1%
 
Other2.6%


SalineCosentino59.7%
 
Houston38.0%
 
Other2.4%


SangamonCosentino48.2%
 
Houston50.4%
 
Other1.4%


SchuylerCosentino45.1%
 
Houston52.7%
 
Other2.2%


ScottCosentino42.4%
 
Houston55.7%
 
Other1.9%


ShelbyCosentino51.7%
 
Houston46.5%
 
Other1.8%


StarkCosentino46.3%
 
Houston50.7%
 
Other3.0%


StephensonCosentino42.2%
 
Houston53.8%
 
Other4.0%


TazewellCosentino52.6%
 
Houston44.6%
 
Other2.8%


UnionCosentino54.4%
 
Houston43.4%
 
Other2.2%


VermilionCosentino50.9%
 
Houston46.3%
 
Other2.8%


WabashCosentino46.8%
 
Houston50.2%
 
Other3.1%


WarrenCosentino40.8%
 
Houston56.7%
 
Other2.5%


WashingtonCosentino40.4%
 
Houston57.6%
 
Other2.1%


WayneCosentino40.5%
 
Houston56.1%
 
Other3.4%


WhiteCosentino55.0%
 
Houston42.0%
 
Other3.0%


WhitesideCosentino47.9%
 
Houston49.4%
 
Other2.7%


WillCosentino53.0%
 
Houston44.1%
 
Other2.9%


WilliamsonCosentino57.2%
 
Houston41.0%
 
Other1.8%


WinnebagoCosentino49.9%
 
Houston46.8%
 
Other3.3%


WoodfordCosentino38.5%
 
Houston58.6%
 
Other2.9%


National DataGraph for 1986 - Illinois Results for 1986

Login

Terms of Use - DCMA Policy - Privacy Policy and Cookies


© Dave Leip's Atlas of U.S. Elections, LLC 2019 All Rights Reserved