1986 Controller General Election Data Graphs - California
Note: The Google advertisement links below may advocate political positions that this site does not endorse.
Data for this Contest was Contributed by on 2016-01-27
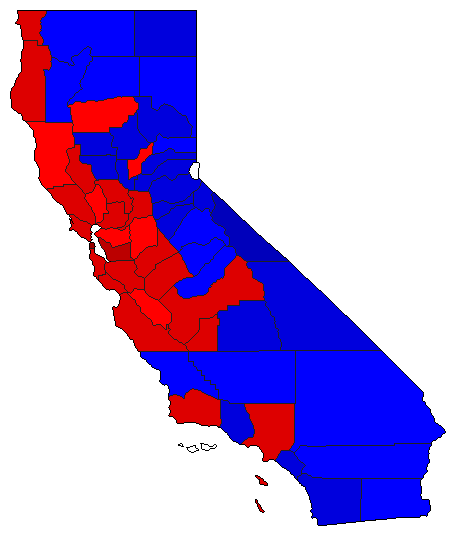
Map

AlamedaDavis65.2%
 
Campbell30.4%
 
Other4.4%


AlpineDavis33.0%
 
Campbell56.1%
 
Other10.9%


AmadorDavis44.9%
 
Campbell50.9%
 
Other4.2%


ButteDavis43.6%
 
Campbell51.6%
 
Other4.8%


CalaverasDavis43.2%
 
Campbell52.4%
 
Other4.5%


ColusaDavis45.9%
 
Campbell50.5%
 
Other3.6%


Contra CostaDavis49.5%
 
Campbell46.6%
 
Other3.9%


Del NorteDavis53.2%
 
Campbell41.3%
 
Other5.5%


El DoradoDavis41.1%
 
Campbell53.4%
 
Other5.5%


FresnoDavis51.9%
 
Campbell44.4%
 
Other3.8%


GlennDavis40.2%
 
Campbell54.3%
 
Other5.5%


HumboldtDavis57.6%
 
Campbell35.2%
 
Other7.2%


ImperialDavis46.8%
 
Campbell48.2%
 
Other5.0%


InyoDavis38.3%
 
Campbell57.6%
 
Other4.0%


KernDavis46.8%
 
Campbell49.3%
 
Other3.9%


KingsDavis52.8%
 
Campbell43.6%
 
Other3.7%


LakeDavis52.7%
 
Campbell42.9%
 
Other4.4%


LassenDavis44.1%
 
Campbell48.5%
 
Other7.5%


Los AngelesDavis55.7%
 
Campbell40.8%
 
Other3.5%


MaderaDavis41.5%
 
Campbell49.9%
 
Other8.7%


MarinDavis56.5%
 
Campbell38.6%
 
Other4.9%


MariposaDavis44.9%
 
Campbell49.7%
 
Other5.5%


MendocinoDavis49.4%
 
Campbell42.0%
 
Other8.7%


MercedDavis50.0%
 
Campbell41.1%
 
Other8.9%


ModocDavis38.3%
 
Campbell55.5%
 
Other6.2%


MonoDavis33.3%
 
Campbell61.5%
 
Other5.2%


MontereyDavis53.1%
 
Campbell42.6%
 
Other4.3%


NapaDavis49.7%
 
Campbell45.6%
 
Other4.7%


NevadaDavis39.9%
 
Campbell54.0%
 
Other6.1%


OrangeDavis37.7%
 
Campbell58.6%
 
Other3.7%


PlacerDavis44.3%
 
Campbell50.2%
 
Other5.5%


PlumasDavis43.3%
 
Campbell50.4%
 
Other6.3%


RiversideDavis47.0%
 
Campbell49.1%
 
Other3.9%


SacramentoDavis52.7%
 
Campbell42.4%
 
Other4.9%


San BenitoDavis47.8%
 
Campbell39.9%
 
Other12.3%


San BernardinoDavis46.1%
 
Campbell49.1%
 
Other4.8%


San DiegoDavis43.6%
 
Campbell50.4%
 
Other5.9%


San FranciscoDavis71.5%
 
Campbell24.0%
 
Other4.4%


San JoaquinDavis48.5%
 
Campbell47.4%
 
Other4.1%


San Luis ObispoDavis47.2%
 
Campbell48.6%
 
Other4.2%


San MateoDavis54.6%
 
Campbell39.8%
 
Other5.6%


Santa BarbaraDavis50.1%
 
Campbell46.2%
 
Other3.7%


Santa ClaraDavis54.5%
 
Campbell40.5%
 
Other4.9%


Santa CruzDavis58.3%
 
Campbell35.2%
 
Other6.5%


ShastaDavis45.3%
 
Campbell49.2%
 
Other5.4%


SierraDavis46.8%
 
Campbell47.9%
 
Other5.3%


SiskiyouDavis43.7%
 
Campbell49.8%
 
Other6.5%


SolanoDavis57.6%
 
Campbell37.8%
 
Other4.6%


SonomaDavis55.6%
 
Campbell39.0%
 
Other5.5%


StanislausDavis51.1%
 
Campbell45.3%
 
Other3.5%


SutterDavis38.1%
 
Campbell56.4%
 
Other5.5%


TehamaDavis49.0%
 
Campbell45.5%
 
Other5.6%


TrinityDavis45.6%
 
Campbell46.1%
 
Other8.4%


TulareDavis43.5%
 
Campbell53.3%
 
Other3.2%


TuolumneDavis48.0%
 
Campbell48.1%
 
Other3.8%


VenturaDavis43.8%
 
Campbell52.1%
 
Other4.1%


YoloDavis56.9%
 
Campbell38.3%
 
Other4.8%


YubaDavis47.4%
 
Campbell47.3%
 
Other5.4%


National DataGraph for 1986 - California Results for 1986

Login

Terms of Use - DCMA Policy - Privacy Policy and Cookies


© Dave Leip's Atlas of U.S. Elections, LLC 2019 All Rights Reserved