1988 State Auditor General Election Data Graphs - Utah
Note: The Google advertisement links below may advocate political positions that this site does not endorse.
Data for this Contest was Contributed by on 2007-06-13
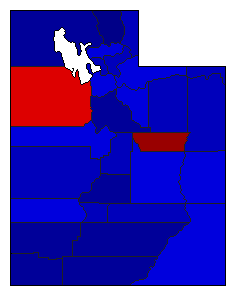
Map

BeaverMiller49.3%
 
Allen50.7%


Box ElderMiller27.1%
 
Allen72.9%


CacheMiller19.7%
 
Allen80.3%


CarbonMiller72.7%
 
Allen27.3%


DaggettMiller38.5%
 
Allen61.5%


DavisMiller31.5%
 
Allen68.5%


DuchesneMiller32.7%
 
Allen67.3%


EmeryMiller48.1%
 
Allen51.9%


GarfieldMiller24.2%
 
Allen75.8%


GrandMiller44.6%
 
Allen55.4%


IronMiller28.4%
 
Allen71.6%


JuabMiller44.1%
 
Allen55.9%


KaneMiller22.0%
 
Allen78.0%


MillardMiller30.7%
 
Allen69.3%


MorganMiller36.3%
 
Allen63.7%


PiuteMiller33.0%
 
Allen67.0%


RichMiller36.1%
 
Allen63.9%


Salt LakeMiller44.5%
 
Allen55.5%


San JuanMiller42.3%
 
Allen57.7%


SanpeteMiller35.2%
 
Allen64.8%


SevierMiller28.5%
 
Allen71.5%


SummitMiller44.0%
 
Allen56.0%


TooeleMiller52.1%
 
Allen47.9%


UintahMiller33.8%
 
Allen66.2%


UtahMiller27.7%
 
Allen72.3%


WasatchMiller41.2%
 
Allen58.8%


WashingtonMiller23.2%
 
Allen76.8%


WayneMiller34.4%
 
Allen65.6%


WeberMiller42.4%
 
Allen57.6%


National DataGraph for 1988 - Utah Results for 1988

Login

Terms of Use - DCMA Policy - Privacy Policy and Cookies


© Dave Leip's Atlas of U.S. Elections, LLC 2019 All Rights Reserved