1992 Presidential Democratic Primary Election Data Graphs - New York
Note: The Google advertisement links below may advocate political positions that this site does not endorse.
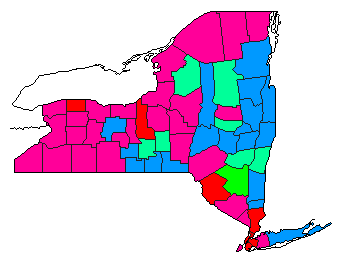
Map

AlbanyClinton26.0%
 
Tsongas36.0%
 
Brown33.1%
 
Other5.0%


AlleganyClinton35.1%
 
Tsongas30.6%
 
Brown29.1%
 
Other5.3%


BroomeClinton33.5%
 
Tsongas34.7%
 
Brown28.1%
 
Other3.7%


CattaraugusClinton36.9%
 
Tsongas28.3%
 
Brown29.0%
 
Other5.8%


CayugaClinton40.2%
 
Tsongas26.2%
 
Brown30.2%
 
Other3.4%


ChautauquaClinton36.1%
 
Tsongas28.4%
 
Brown31.4%
 
Other4.1%


ChemungClinton36.7%
 
Tsongas37.5%
 
Brown21.8%
 
Other4.0%


ChenangoClinton33.5%
 
Tsongas31.1%
 
Brown31.4%
 
Other4.1%


ClintonClinton36.5%
 
Tsongas35.2%
 
Brown23.6%
 
Other4.7%


ColumbiaClinton28.7%
 
Tsongas30.6%
 
Brown36.5%
 
Other4.2%


CortlandClinton32.7%
 
Tsongas27.7%
 
Brown36.3%
 
Other3.3%


DelawareClinton33.5%
 
Tsongas30.7%
 
Brown30.2%
 
Other5.6%


DutchessClinton27.3%
 
Tsongas37.8%
 
Brown31.8%
 
Other3.1%


ErieClinton38.8%
 
Tsongas24.7%
 
Brown29.3%
 
Other7.1%


EssexClinton32.1%
 
Tsongas38.5%
 
Brown24.3%
 
Other5.1%


FranklinClinton38.2%
 
Tsongas33.4%
 
Brown22.9%
 
Other5.6%


FultonClinton36.3%
 
Tsongas26.0%
 
Brown34.6%
 
Other3.1%


GeneseeClinton32.9%
 
Tsongas29.0%
 
Brown32.1%
 
Other6.0%


GreeneClinton29.0%
 
Tsongas30.2%
 
Brown36.6%
 
Other4.2%


HamiltonClinton32.2%
 
Tsongas27.4%
 
Brown34.2%
 
Other6.2%


HerkimerClinton33.4%
 
Tsongas34.1%
 
Brown28.7%
 
Other3.8%


JeffersonClinton37.3%
 
Tsongas24.0%
 
Brown34.5%
 
Other4.1%


LewisClinton35.8%
 
Tsongas21.2%
 
Brown38.3%
 
Other4.6%


LivingstonClinton37.4%
 
Tsongas33.5%
 
Brown24.9%
 
Other4.2%


MadisonClinton35.6%
 
Tsongas32.8%
 
Brown28.1%
 
Other3.5%


MonroeClinton36.4%
 
Tsongas35.0%
 
Brown25.1%
 
Other3.5%


MontgomeryClinton33.0%
 
Tsongas29.1%
 
Brown34.3%
 
Other3.6%


NassauClinton39.1%
 
Tsongas39.0%
 
Brown18.6%
 
Other3.3%


NiagaraClinton36.3%
 
Tsongas22.8%
 
Brown34.3%
 
Other6.6%


OneidaClinton35.7%
 
Tsongas33.3%
 
Brown26.5%
 
Other4.5%


OnondagaClinton35.4%
 
Tsongas31.6%
 
Brown29.8%
 
Other3.2%


OntarioClinton33.2%
 
Tsongas36.3%
 
Brown27.2%
 
Other3.3%


OrangeClinton34.8%
 
Tsongas29.9%
 
Brown31.4%
 
Other3.9%


OrleansClinton41.7%
 
Tsongas29.8%
 
Brown25.0%
 
Other3.4%


OswegoClinton36.2%
 
Tsongas29.5%
 
Brown30.3%
 
Other4.0%


OtsegoClinton28.4%
 
Tsongas34.9%
 
Brown33.3%
 
Other3.4%


PutnamClinton29.8%
 
Tsongas35.4%
 
Brown31.8%
 
Other3.0%


RensselaerClinton25.1%
 
Tsongas37.3%
 
Brown33.1%
 
Other4.4%


RocklandClinton38.8%
 
Tsongas36.9%
 
Brown21.1%
 
Other3.3%


St. LawrenceClinton33.4%
 
Tsongas27.8%
 
Brown29.9%
 
Other8.9%


SaratogaClinton24.5%
 
Tsongas37.1%
 
Brown34.8%
 
Other3.7%


SchenectadyClinton27.1%
 
Tsongas35.7%
 
Brown33.7%
 
Other3.5%


SchoharieClinton32.8%
 
Tsongas32.9%
 
Brown30.8%
 
Other3.5%


SchuylerClinton29.7%
 
Tsongas32.7%
 
Brown32.6%
 
Other5.0%


SenecaClinton37.9%
 
Tsongas31.5%
 
Brown26.5%
 
Other4.1%


SteubenClinton40.0%
 
Tsongas30.2%
 
Brown25.9%
 
Other3.9%


SuffolkClinton31.9%
 
Tsongas35.2%
 
Brown28.8%
 
Other4.2%


SullivanClinton42.4%
 
Tsongas27.7%
 
Brown26.1%
 
Other3.8%


TiogaClinton31.0%
 
Tsongas37.5%
 
Brown27.1%
 
Other4.4%


TompkinsClinton27.3%
 
Tsongas32.6%
 
Brown35.4%
 
Other4.7%


UlsterClinton26.9%
 
Tsongas25.1%
 
Brown44.1%
 
Other3.9%


WarrenClinton27.4%
 
Tsongas36.6%
 
Brown31.3%
 
Other4.7%


WashingtonClinton29.5%
 
Tsongas33.6%
 
Brown32.3%
 
Other4.6%


WayneClinton37.6%
 
Tsongas33.0%
 
Brown25.6%
 
Other3.8%


WestchesterClinton40.4%
 
Tsongas35.2%
 
Brown21.0%
 
Other3.4%


WyomingClinton37.8%
 
Tsongas28.4%
 
Brown28.9%
 
Other4.8%


YatesClinton35.8%
 
Tsongas35.4%
 
Brown24.9%
 
Other3.9%


BronxClinton50.9%
 
Tsongas17.2%
 
Brown26.0%
 
Other5.9%


KingsClinton49.8%
 
Tsongas22.2%
 
Brown23.7%
 
Other4.3%


New YorkClinton42.8%
 
Tsongas24.8%
 
Brown28.9%
 
Other3.6%


QueensClinton44.9%
 
Tsongas29.7%
 
Brown21.7%
 
Other3.8%


RichmondClinton35.5%
 
Tsongas33.0%
 
Brown27.6%
 
Other3.9%


National DataGraph for 1992 - New York Results for 1992

Login

Terms of Use - DCMA Policy - Privacy Policy and Cookies


© Dave Leip's Atlas of U.S. Elections, LLC 2019 All Rights Reserved