1994 Senatorial General Election Data Graphs - New York
Note: The Google advertisement links below may advocate political positions that this site does not endorse.
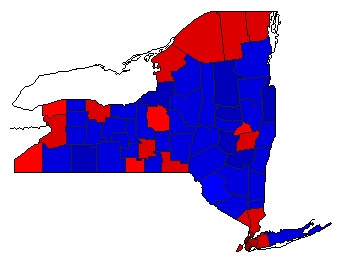
Map

AlbanyMoynihan59.9%
 
Castro37.7%
 
Betancourt0.4%
 
Other2.0%


AlleganyMoynihan32.8%
 
Castro61.3%
 
Betancourt0.8%
 
Other5.0%


BronxMoynihan75.2%
 
Castro21.8%
 
Betancourt0.8%
 
Other2.2%


BroomeMoynihan54.7%
 
Castro42.5%
 
Betancourt0.5%
 
Other2.4%


CattaraugusMoynihan36.6%
 
Castro58.3%
 
Betancourt0.5%
 
Other4.5%


CayugaMoynihan39.8%
 
Castro56.2%
 
Betancourt0.6%
 
Other3.3%


ChautauquaMoynihan48.4%
 
Castro47.7%
 
Betancourt0.5%
 
Other3.4%


ChemungMoynihan48.2%
 
Castro46.8%
 
Betancourt1.0%
 
Other4.0%


ChenangoMoynihan38.9%
 
Castro57.3%
 
Betancourt0.8%
 
Other2.9%


ClintonMoynihan54.6%
 
Castro41.2%
 
Betancourt0.6%
 
Other3.6%


ColumbiaMoynihan40.9%
 
Castro56.5%
 
Betancourt0.5%
 
Other2.1%


CortlandMoynihan38.5%
 
Castro57.7%
 
Betancourt0.6%
 
Other3.2%


DelawareMoynihan40.2%
 
Castro57.2%
 
Betancourt0.5%
 
Other2.1%


DutchessMoynihan43.2%
 
Castro53.0%
 
Betancourt0.5%
 
Other3.4%


ErieMoynihan57.6%
 
Castro38.7%
 
Betancourt0.4%
 
Other3.3%


EssexMoynihan43.2%
 
Castro52.0%
 
Betancourt0.7%
 
Other4.1%


FranklinMoynihan55.4%
 
Castro40.0%
 
Betancourt0.6%
 
Other3.9%


FultonMoynihan35.3%
 
Castro60.6%
 
Betancourt0.7%
 
Other3.3%


GeneseeMoynihan40.5%
 
Castro54.1%
 
Betancourt1.3%
 
Other4.1%


GreeneMoynihan34.9%
 
Castro61.8%
 
Betancourt0.5%
 
Other2.8%


HamiltonMoynihan30.8%
 
Castro64.9%
 
Betancourt0.8%
 
Other3.5%


HerkimerMoynihan40.3%
 
Castro56.3%
 
Betancourt0.6%
 
Other2.8%


JeffersonMoynihan58.1%
 
Castro37.9%
 
Betancourt0.7%
 
Other3.3%


KingsMoynihan74.2%
 
Castro23.3%
 
Betancourt0.5%
 
Other1.9%


LewisMoynihan43.9%
 
Castro52.0%
 
Betancourt0.7%
 
Other3.5%


LivingstonMoynihan42.5%
 
Castro52.8%
 
Betancourt1.5%
 
Other3.2%


MadisonMoynihan41.8%
 
Castro54.5%
 
Betancourt0.6%
 
Other3.1%


MonroeMoynihan53.5%
 
Castro41.8%
 
Betancourt1.8%
 
Other2.9%


MontgomeryMoynihan42.9%
 
Castro53.9%
 
Betancourt0.5%
 
Other2.7%


NassauMoynihan50.1%
 
Castro46.7%
 
Betancourt0.3%
 
Other2.9%


New YorkMoynihan82.7%
 
Castro15.1%
 
Betancourt0.4%
 
Other1.8%


NiagaraMoynihan48.3%
 
Castro48.1%
 
Betancourt0.4%
 
Other3.2%


OneidaMoynihan45.7%
 
Castro50.7%
 
Betancourt0.5%
 
Other3.1%


OnondagaMoynihan49.2%
 
Castro47.9%
 
Betancourt0.4%
 
Other2.5%


OntarioMoynihan44.7%
 
Castro50.9%
 
Betancourt1.8%
 
Other2.6%


OrangeMoynihan42.6%
 
Castro53.7%
 
Betancourt0.5%
 
Other3.2%


OrleansMoynihan37.0%
 
Castro58.8%
 
Betancourt1.4%
 
Other2.7%


OswegoMoynihan34.6%
 
Castro61.3%
 
Betancourt0.7%
 
Other3.4%


OtsegoMoynihan44.5%
 
Castro52.8%
 
Betancourt0.6%
 
Other2.1%


PutnamMoynihan40.2%
 
Castro56.5%
 
Betancourt0.3%
 
Other3.0%


QueensMoynihan67.4%
 
Castro30.4%
 
Betancourt0.4%
 
Other1.8%


RensselaerMoynihan46.6%
 
Castro50.2%
 
Betancourt0.5%
 
Other2.7%


RichmondMoynihan51.2%
 
Castro45.8%
 
Betancourt0.3%
 
Other2.6%


RocklandMoynihan55.4%
 
Castro41.8%
 
Betancourt0.3%
 
Other2.5%


St. LawrenceMoynihan58.2%
 
Castro38.3%
 
Betancourt0.5%
 
Other2.9%


SaratogaMoynihan40.0%
 
Castro56.6%
 
Betancourt0.7%
 
Other2.7%


SchenectadyMoynihan48.7%
 
Castro48.5%
 
Betancourt0.5%
 
Other2.4%


SchoharieMoynihan36.1%
 
Castro61.1%
 
Betancourt0.6%
 
Other2.3%


SchuylerMoynihan39.9%
 
Castro55.1%
 
Betancourt0.9%
 
Other4.1%


SenecaMoynihan40.5%
 
Castro55.4%
 
Betancourt0.9%
 
Other3.2%


SteubenMoynihan38.9%
 
Castro55.9%
 
Betancourt1.0%
 
Other4.2%


SuffolkMoynihan42.0%
 
Castro54.3%
 
Betancourt0.4%
 
Other3.3%


SullivanMoynihan47.9%
 
Castro49.5%
 
Betancourt0.3%
 
Other2.3%


TiogaMoynihan41.3%
 
Castro54.0%
 
Betancourt0.8%
 
Other3.9%


TompkinsMoynihan55.8%
 
Castro40.5%
 
Betancourt0.6%
 
Other3.1%


UlsterMoynihan44.4%
 
Castro52.2%
 
Betancourt0.4%
 
Other2.9%


WarrenMoynihan38.0%
 
Castro58.8%
 
Betancourt0.5%
 
Other2.7%


WashingtonMoynihan34.6%
 
Castro61.5%
 
Betancourt0.8%
 
Other3.1%


WayneMoynihan36.0%
 
Castro58.0%
 
Betancourt2.2%
 
Other3.8%


WestchesterMoynihan56.4%
 
Castro40.9%
 
Betancourt0.3%
 
Other2.4%


WyomingMoynihan36.7%
 
Castro57.9%
 
Betancourt1.1%
 
Other4.3%


YatesMoynihan36.5%
 
Castro59.0%
 
Betancourt1.2%
 
Other3.2%


National DataGraph for 1994 - New York Results for 1994

Login

Terms of Use - DCMA Policy - Privacy Policy and Cookies


© Dave Leip's Atlas of U.S. Elections, LLC 2019 All Rights Reserved