1994 State Treasurer General Election Data Graphs - South Carolina
Note: The Google advertisement links below may advocate political positions that this site does not endorse.
Data for this Contest was Contributed by on 2011-02-25
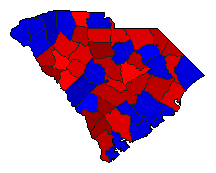
Map

AbbevillePatterson69.3%
 
Eckstrom29.8%
 
Other0.9%


AikenPatterson33.0%
 
Eckstrom63.7%
 
Other3.3%


AllendalePatterson74.2%
 
Eckstrom23.3%
 
Other2.5%


AndersonPatterson42.9%
 
Eckstrom52.9%
 
Other4.2%


BambergPatterson72.3%
 
Eckstrom26.0%
 
Other1.6%


BarnwellPatterson48.1%
 
Eckstrom49.9%
 
Other2.0%


BeaufortPatterson38.9%
 
Eckstrom58.9%
 
Other2.2%


BerkeleyPatterson41.7%
 
Eckstrom55.7%
 
Other2.6%


CalhounPatterson58.6%
 
Eckstrom38.6%
 
Other2.9%


CharlestonPatterson46.3%
 
Eckstrom51.3%
 
Other2.3%


CherokeePatterson49.1%
 
Eckstrom47.1%
 
Other3.8%


ChesterPatterson59.8%
 
Eckstrom35.6%
 
Other4.6%


ChesterfieldPatterson58.1%
 
Eckstrom38.8%
 
Other3.1%


ClarendonPatterson62.1%
 
Eckstrom35.8%
 
Other2.1%


ColletonPatterson56.4%
 
Eckstrom41.7%
 
Other1.9%


DarlingtonPatterson47.2%
 
Eckstrom48.8%
 
Other4.0%


DillonPatterson61.8%
 
Eckstrom37.0%
 
Other1.2%


DorchesterPatterson39.9%
 
Eckstrom57.7%
 
Other2.3%


EdgefieldPatterson48.9%
 
Eckstrom48.8%
 
Other2.3%


FairfieldPatterson70.5%
 
Eckstrom27.3%
 
Other2.2%


FlorencePatterson45.7%
 
Eckstrom52.6%
 
Other1.7%


GeorgetownPatterson53.5%
 
Eckstrom44.5%
 
Other2.1%


GreenvillePatterson36.6%
 
Eckstrom60.6%
 
Other2.7%


GreenwoodPatterson49.1%
 
Eckstrom48.7%
 
Other2.2%


HamptonPatterson71.8%
 
Eckstrom24.7%
 
Other3.5%


HorryPatterson45.1%
 
Eckstrom52.6%
 
Other2.3%


JasperPatterson67.8%
 
Eckstrom30.4%
 
Other1.8%


KershawPatterson44.4%
 
Eckstrom51.6%
 
Other4.0%


LancasterPatterson55.2%
 
Eckstrom40.7%
 
Other4.0%


LaurensPatterson53.1%
 
Eckstrom44.2%
 
Other2.7%


LeePatterson67.2%
 
Eckstrom31.6%
 
Other1.2%


LexingtonPatterson38.5%
 
Eckstrom57.9%
 
Other3.6%


McCormickPatterson72.9%
 
Eckstrom24.7%
 
Other2.4%


MarionPatterson59.8%
 
Eckstrom37.1%
 
Other3.1%


MarlboroPatterson66.6%
 
Eckstrom28.9%
 
Other4.5%


NewberryPatterson53.0%
 
Eckstrom43.9%
 
Other3.1%


OconeePatterson38.7%
 
Eckstrom57.3%
 
Other4.0%


OrangeburgPatterson65.8%
 
Eckstrom31.7%
 
Other2.5%


PickensPatterson36.6%
 
Eckstrom59.9%
 
Other3.5%


RichlandPatterson60.4%
 
Eckstrom36.6%
 
Other3.1%


SaludaPatterson54.2%
 
Eckstrom42.2%
 
Other3.6%


SpartanburgPatterson43.4%
 
Eckstrom54.3%
 
Other2.3%


SumterPatterson50.0%
 
Eckstrom47.9%
 
Other2.1%


UnionPatterson62.3%
 
Eckstrom34.8%
 
Other2.9%


WilliamsburgPatterson67.4%
 
Eckstrom30.9%
 
Other1.7%


YorkPatterson41.5%
 
Eckstrom54.8%
 
Other3.7%


National DataGraph for 1994 - South Carolina Results for 1994

Login

Terms of Use - DCMA Policy - Privacy Policy and Cookies


© Dave Leip's Atlas of U.S. Elections, LLC 2019 All Rights Reserved