1998 Controller General Election Data Graphs - California
Note: The Google advertisement links below may advocate political positions that this site does not endorse.
Data for this Contest was Contributed by on 2007-01-19
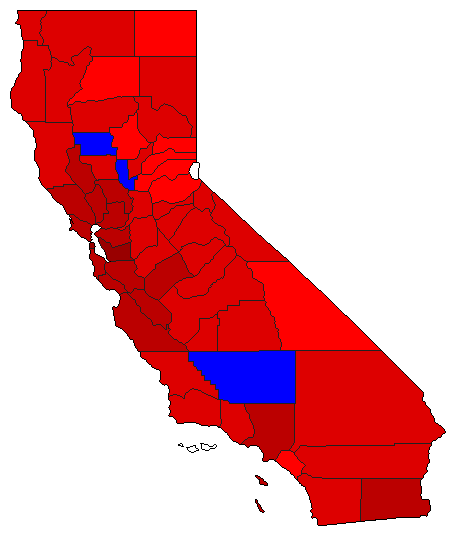
Map

AlamedaConnell74.2%
 
Barrales19.8%
 
Other6.0%


AlpineConnell57.8%
 
Barrales33.2%
 
Other8.9%


AmadorConnell56.8%
 
Barrales38.1%
 
Other5.1%


ButteConnell49.7%
 
Barrales43.3%
 
Other7.0%


CalaverasConnell53.9%
 
Barrales38.8%
 
Other7.3%


ColusaConnell51.6%
 
Barrales43.6%
 
Other4.8%


Contra CostaConnell63.9%
 
Barrales30.4%
 
Other5.8%


Del NorteConnell57.8%
 
Barrales33.2%
 
Other9.0%


El DoradoConnell48.3%
 
Barrales45.4%
 
Other6.3%


FresnoConnell52.6%
 
Barrales41.6%
 
Other5.8%


GlennConnell46.1%
 
Barrales47.4%
 
Other6.5%


HumboldtConnell59.7%
 
Barrales28.7%
 
Other11.6%


ImperialConnell61.0%
 
Barrales32.1%
 
Other6.8%


InyoConnell49.0%
 
Barrales43.9%
 
Other7.1%


KernConnell46.9%
 
Barrales47.1%
 
Other5.9%


KingsConnell56.0%
 
Barrales38.1%
 
Other5.9%


LakeConnell62.9%
 
Barrales30.5%
 
Other6.7%


LassenConnell51.9%
 
Barrales40.1%
 
Other8.0%


Los AngelesConnell69.1%
 
Barrales26.1%
 
Other4.8%


MaderaConnell50.6%
 
Barrales43.3%
 
Other6.1%


MarinConnell68.9%
 
Barrales25.9%
 
Other5.2%


MariposaConnell50.4%
 
Barrales41.6%
 
Other8.0%


MendocinoConnell59.8%
 
Barrales28.2%
 
Other12.1%


MercedConnell61.1%
 
Barrales33.9%
 
Other5.0%


ModocConnell48.3%
 
Barrales43.1%
 
Other8.6%


MonoConnell52.7%
 
Barrales40.3%
 
Other7.0%


MontereyConnell62.3%
 
Barrales31.1%
 
Other6.7%


NapaConnell61.2%
 
Barrales32.0%
 
Other6.8%


NevadaConnell49.3%
 
Barrales44.3%
 
Other6.4%


OrangeConnell49.3%
 
Barrales44.3%
 
Other6.4%


PlacerConnell48.3%
 
Barrales46.4%
 
Other5.3%


PlumasConnell52.1%
 
Barrales41.5%
 
Other6.4%


RiversideConnell55.1%
 
Barrales38.9%
 
Other5.9%


SacramentoConnell57.6%
 
Barrales36.8%
 
Other5.7%


San BenitoConnell60.2%
 
Barrales32.5%
 
Other7.3%


San BernardinoConnell58.0%
 
Barrales35.8%
 
Other6.1%


San DiegoConnell53.6%
 
Barrales39.5%
 
Other6.8%


San FranciscoConnell78.6%
 
Barrales15.0%
 
Other6.4%


San JoaquinConnell59.4%
 
Barrales35.7%
 
Other5.0%


San Luis ObispoConnell54.3%
 
Barrales39.8%
 
Other5.9%


San MateoConnell62.0%
 
Barrales33.1%
 
Other4.9%


Santa BarbaraConnell57.9%
 
Barrales36.2%
 
Other5.8%


Santa ClaraConnell62.6%
 
Barrales30.7%
 
Other6.7%


Santa CruzConnell66.9%
 
Barrales24.0%
 
Other9.1%


ShastaConnell46.4%
 
Barrales45.2%
 
Other8.3%


SierraConnell49.1%
 
Barrales39.2%
 
Other11.7%


SiskiyouConnell51.3%
 
Barrales41.1%
 
Other7.6%


SolanoConnell65.2%
 
Barrales28.4%
 
Other6.4%


SonomaConnell64.3%
 
Barrales27.9%
 
Other7.8%


StanislausConnell57.9%
 
Barrales37.4%
 
Other4.7%


SutterConnell46.2%
 
Barrales48.4%
 
Other5.4%


TehamaConnell50.8%
 
Barrales40.8%
 
Other8.4%


TrinityConnell52.5%
 
Barrales35.1%
 
Other12.4%


TulareConnell51.6%
 
Barrales42.7%
 
Other5.7%


TuolumneConnell56.8%
 
Barrales38.0%
 
Other5.2%


VenturaConnell57.4%
 
Barrales36.3%
 
Other6.3%


YoloConnell64.0%
 
Barrales30.0%
 
Other6.0%


YubaConnell51.0%
 
Barrales41.8%
 
Other7.2%


National DataGraph for 1998 - California Results for 1998

Login

Terms of Use - DCMA Policy - Privacy Policy and Cookies


© Dave Leip's Atlas of U.S. Elections, LLC 2019 All Rights Reserved