2000 Secretary of State Democratic Primary Election Data Graphs - West Virginia
Note: The Google advertisement links below may advocate political positions that this site does not endorse.
Data for this Contest was Contributed by on 2007-02-27
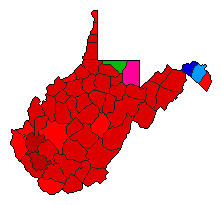
Map

BarbourManchin58.8%
 
Pritt23.0%
 
Oliverio15.3%
 
Other2.9%


BerkeleyManchin39.6%
 
Pritt40.0%
 
Oliverio15.6%
 
Other4.9%


BooneManchin50.5%
 
Pritt35.1%
 
Oliverio4.1%
 
Other10.3%


BraxtonManchin50.9%
 
Pritt30.0%
 
Oliverio14.4%
 
Other4.7%


BrookeManchin49.3%
 
Pritt34.9%
 
Oliverio10.9%
 
Other4.8%


CabellManchin42.9%
 
Pritt19.2%
 
Oliverio6.2%
 
Other31.8%


CalhounManchin59.1%
 
Pritt30.5%
 
Oliverio5.8%
 
Other4.6%


ClayManchin56.7%
 
Pritt33.3%
 
Oliverio5.6%
 
Other4.4%


DoddridgeManchin54.1%
 
Pritt23.2%
 
Oliverio17.2%
 
Other5.5%


FayetteManchin53.8%
 
Pritt31.6%
 
Oliverio7.4%
 
Other7.2%


GilmerManchin57.4%
 
Pritt27.8%
 
Oliverio11.2%
 
Other3.6%


GrantManchin50.6%
 
Pritt34.6%
 
Oliverio10.2%
 
Other4.7%


GreenbrierManchin54.7%
 
Pritt30.2%
 
Oliverio8.5%
 
Other6.6%


HampshireManchin53.2%
 
Pritt33.8%
 
Oliverio7.3%
 
Other5.6%


HancockManchin42.2%
 
Pritt41.8%
 
Oliverio11.0%
 
Other5.0%


HardyManchin58.0%
 
Pritt24.4%
 
Oliverio10.9%
 
Other6.7%


HarrisonManchin52.4%
 
Pritt21.1%
 
Oliverio21.9%
 
Other4.6%


JacksonManchin53.1%
 
Pritt30.8%
 
Oliverio4.8%
 
Other11.3%


JeffersonManchin42.7%
 
Pritt40.6%
 
Oliverio10.3%
 
Other6.4%


KanawhaManchin49.6%
 
Pritt28.9%
 
Oliverio12.7%
 
Other8.7%


LewisManchin58.4%
 
Pritt23.0%
 
Oliverio14.1%
 
Other4.4%


LincolnManchin63.7%
 
Pritt23.8%
 
Oliverio2.0%
 
Other10.4%


LoganManchin61.0%
 
Pritt31.3%
 
Oliverio4.5%
 
Other3.2%


McDowellManchin49.9%
 
Pritt40.5%
 
Oliverio5.4%
 
Other4.2%


MarionManchin50.8%
 
Pritt18.6%
 
Oliverio27.9%
 
Other2.6%


MarshallManchin52.4%
 
Pritt32.9%
 
Oliverio9.4%
 
Other5.3%


MasonManchin55.5%
 
Pritt32.2%
 
Oliverio2.8%
 
Other9.5%


MercerManchin53.7%
 
Pritt28.5%
 
Oliverio13.8%
 
Other4.0%


MineralManchin55.9%
 
Pritt28.8%
 
Oliverio8.6%
 
Other6.7%


MingoManchin51.3%
 
Pritt41.9%
 
Oliverio1.5%
 
Other5.2%


MonongaliaManchin20.2%
 
Pritt15.8%
 
Oliverio61.2%
 
Other2.8%


MonroeManchin50.2%
 
Pritt35.4%
 
Oliverio8.4%
 
Other6.0%


MorganManchin34.5%
 
Pritt54.9%
 
Oliverio6.7%
 
Other3.9%


NicholasManchin54.8%
 
Pritt32.9%
 
Oliverio6.8%
 
Other5.5%


OhioManchin51.9%
 
Pritt27.4%
 
Oliverio16.9%
 
Other3.8%


PendletonManchin58.2%
 
Pritt28.1%
 
Oliverio8.2%
 
Other5.5%


PleasantsManchin46.5%
 
Pritt29.6%
 
Oliverio19.9%
 
Other4.0%


PocahontasManchin53.9%
 
Pritt32.9%
 
Oliverio7.5%
 
Other5.7%


PrestonManchin39.6%
 
Pritt23.6%
 
Oliverio33.3%
 
Other3.5%


PutnamManchin53.1%
 
Pritt25.7%
 
Oliverio8.6%
 
Other12.6%


RaleighManchin58.3%
 
Pritt25.0%
 
Oliverio8.9%
 
Other7.8%


RandolphManchin59.6%
 
Pritt27.0%
 
Oliverio10.3%
 
Other3.1%


RitchieManchin57.6%
 
Pritt30.4%
 
Oliverio7.7%
 
Other4.3%


RoaneManchin50.0%
 
Pritt35.6%
 
Oliverio7.0%
 
Other7.3%


SummersManchin52.3%
 
Pritt32.5%
 
Oliverio7.8%
 
Other7.4%


TaylorManchin57.3%
 
Pritt20.5%
 
Oliverio18.1%
 
Other4.1%


TuckerManchin59.7%
 
Pritt25.0%
 
Oliverio11.8%
 
Other3.6%


TylerManchin59.0%
 
Pritt20.9%
 
Oliverio15.9%
 
Other4.1%


UpshurManchin53.2%
 
Pritt27.5%
 
Oliverio14.8%
 
Other4.4%


WayneManchin49.0%
 
Pritt30.0%
 
Oliverio3.5%
 
Other17.5%


WebsterManchin50.0%
 
Pritt36.2%
 
Oliverio10.0%
 
Other3.8%


WetzelManchin59.3%
 
Pritt25.0%
 
Oliverio10.3%
 
Other5.3%


WirtManchin54.3%
 
Pritt34.8%
 
Oliverio6.8%
 
Other4.1%


WoodManchin58.0%
 
Pritt27.4%
 
Oliverio9.0%
 
Other5.6%


WyomingManchin54.6%
 
Pritt35.2%
 
Oliverio4.3%
 
Other6.0%


National DataGraph for 2000 - West Virginia Results for 2000

Login

Terms of Use - DCMA Policy - Privacy Policy and Cookies


© Dave Leip's Atlas of U.S. Elections, LLC 2019 All Rights Reserved