2002 Secretary of State General Election Data Graphs - California
Note: The Google advertisement links below may advocate political positions that this site does not endorse.
Data for this Contest was Contributed by on 2007-01-17
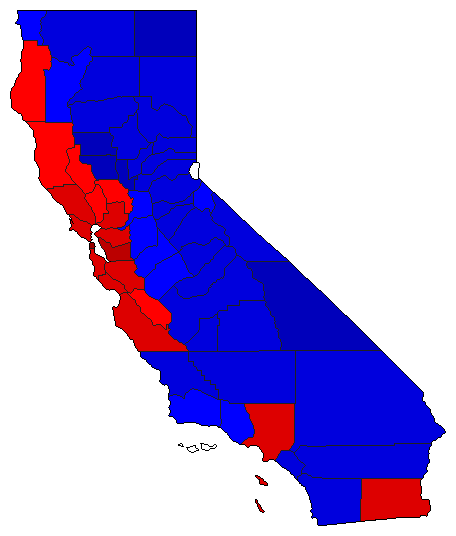
Map

AlamedaShelley63.3%
 
Olberg22.6%
 
Other14.1%


AlpineShelley40.1%
 
Olberg41.2%
 
Other18.7%


AmadorShelley34.4%
 
Olberg54.2%
 
Other11.4%


ButteShelley32.9%
 
Olberg52.5%
 
Other14.6%


CalaverasShelley33.4%
 
Olberg53.7%
 
Other12.9%


ColusaShelley28.8%
 
Olberg61.5%
 
Other9.7%


Contra CostaShelley51.9%
 
Olberg37.3%
 
Other10.7%


Del NorteShelley39.6%
 
Olberg46.6%
 
Other13.9%


El DoradoShelley30.9%
 
Olberg58.3%
 
Other10.8%


FresnoShelley37.8%
 
Olberg53.6%
 
Other8.6%


GlennShelley27.2%
 
Olberg62.7%
 
Other10.1%


HumboldtShelley41.4%
 
Olberg36.3%
 
Other22.3%


ImperialShelley50.3%
 
Olberg40.2%
 
Other9.6%


InyoShelley27.2%
 
Olberg62.8%
 
Other10.0%


KernShelley33.7%
 
Olberg57.5%
 
Other8.9%


KingsShelley37.2%
 
Olberg53.9%
 
Other9.0%


LakeShelley46.7%
 
Olberg40.2%
 
Other13.1%


LassenShelley29.3%
 
Olberg58.9%
 
Other11.8%


Los AngelesShelley54.7%
 
Olberg34.1%
 
Other11.2%


MaderaShelley32.5%
 
Olberg58.9%
 
Other8.6%


MarinShelley58.4%
 
Olberg28.0%
 
Other13.5%


MariposaShelley31.8%
 
Olberg55.0%
 
Other13.2%


MendocinoShelley43.6%
 
Olberg32.7%
 
Other23.7%


MercedShelley44.0%
 
Olberg47.4%
 
Other8.6%


ModocShelley24.7%
 
Olberg62.5%
 
Other12.8%


MonoShelley33.8%
 
Olberg52.4%
 
Other13.8%


MontereyShelley50.8%
 
Olberg37.2%
 
Other12.0%


NapaShelley48.6%
 
Olberg38.1%
 
Other13.4%


NevadaShelley32.6%
 
Olberg52.8%
 
Other14.6%


OrangeShelley32.5%
 
Olberg57.4%
 
Other10.1%


PlacerShelley31.2%
 
Olberg59.7%
 
Other9.1%


PlumasShelley31.3%
 
Olberg55.2%
 
Other13.5%


RiversideShelley38.1%
 
Olberg53.1%
 
Other8.7%


SacramentoShelley43.1%
 
Olberg45.6%
 
Other11.3%


San BenitoShelley46.0%
 
Olberg41.7%
 
Other12.4%


San BernardinoShelley38.5%
 
Olberg51.5%
 
Other10.0%


San DiegoShelley38.6%
 
Olberg50.9%
 
Other10.5%


San FranciscoShelley73.7%
 
Olberg12.9%
 
Other13.4%


San JoaquinShelley42.1%
 
Olberg48.2%
 
Other9.7%


San Luis ObispoShelley34.2%
 
Olberg52.3%
 
Other13.6%


San MateoShelley57.8%
 
Olberg29.0%
 
Other13.2%


Santa BarbaraShelley40.4%
 
Olberg46.8%
 
Other12.8%


Santa ClaraShelley54.3%
 
Olberg34.3%
 
Other11.4%


Santa CruzShelley51.7%
 
Olberg28.8%
 
Other19.5%


ShastaShelley29.8%
 
Olberg59.1%
 
Other11.2%


SierraShelley29.8%
 
Olberg56.0%
 
Other14.2%


SiskiyouShelley31.7%
 
Olberg54.8%
 
Other13.5%


SolanoShelley50.8%
 
Olberg38.1%
 
Other11.1%


SonomaShelley51.1%
 
Olberg30.9%
 
Other18.1%


StanislausShelley41.9%
 
Olberg49.1%
 
Other9.0%


SutterShelley29.1%
 
Olberg62.4%
 
Other8.6%


TehamaShelley31.1%
 
Olberg56.5%
 
Other12.4%


TrinityShelley34.9%
 
Olberg47.1%
 
Other18.0%


TulareShelley32.9%
 
Olberg58.1%
 
Other8.9%


TuolumneShelley37.3%
 
Olberg51.6%
 
Other11.1%


VenturaShelley39.4%
 
Olberg49.0%
 
Other11.6%


YoloShelley48.9%
 
Olberg37.4%
 
Other13.7%


YubaShelley30.7%
 
Olberg57.7%
 
Other11.7%


National DataGraph for 2002 - California Results for 2002

Login

Terms of Use - DCMA Policy - Privacy Policy and Cookies


© Dave Leip's Atlas of U.S. Elections, LLC 2019 All Rights Reserved