2004 Senatorial General Election Data Graphs - Alabama
Note: The Google advertisement links below may advocate political positions that this site does not endorse.
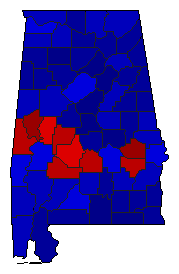
Map

AutaugaSowell20.1%
 
Shelby79.8%
 
Other0.2%


BaldwinSowell19.8%
 
Shelby80.0%
 
Other0.2%


BarbourSowell38.6%
 
Shelby61.2%
 
Other0.1%


BibbSowell24.1%
 
Shelby75.8%
 
Other0.1%


BlountSowell15.6%
 
Shelby84.2%
 
Other0.2%


BullockSowell61.7%
 
Shelby38.3%
 
Other0.0%


ButlerSowell36.2%
 
Shelby63.7%
 
Other0.1%


CalhounSowell27.2%
 
Shelby72.7%
 
Other0.1%


ChambersSowell37.6%
 
Shelby62.4%


CherokeeSowell29.5%
 
Shelby70.4%
 
Other0.1%


ChiltonSowell19.0%
 
Shelby80.8%
 
Other0.2%


ChoctawSowell43.1%
 
Shelby56.8%
 
Other0.1%


ClarkeSowell37.4%
 
Shelby62.5%
 
Other0.1%


ClaySowell23.9%
 
Shelby76.0%
 
Other0.1%


CleburneSowell20.7%
 
Shelby79.1%
 
Other0.2%


CoffeeSowell20.5%
 
Shelby79.4%
 
Other0.1%


ColbertSowell40.2%
 
Shelby59.8%
 
Other0.1%


ConecuhSowell41.8%
 
Shelby58.1%
 
Other0.1%


CoosaSowell36.2%
 
Shelby63.7%
 
Other0.1%


CovingtonSowell19.2%
 
Shelby80.7%
 
Other0.1%


CrenshawSowell26.5%
 
Shelby73.3%
 
Other0.2%


CullmanSowell20.5%
 
Shelby79.4%
 
Other0.2%


DaleSowell21.3%
 
Shelby78.5%
 
Other0.2%


DallasSowell52.3%
 
Shelby47.6%
 
Other0.1%


DeKalbSowell25.5%
 
Shelby74.5%


ElmoreSowell19.2%
 
Shelby80.6%
 
Other0.2%


EscambiaSowell29.2%
 
Shelby70.7%
 
Other0.1%


EtowahSowell32.2%
 
Shelby67.6%
 
Other0.2%


FayetteSowell26.0%
 
Shelby73.9%
 
Other0.2%


FranklinSowell32.1%
 
Shelby67.8%
 
Other0.1%


GenevaSowell16.5%
 
Shelby83.3%
 
Other0.2%


GreeneSowell71.8%
 
Shelby28.2%
 
Other0.0%


HaleSowell50.3%
 
Shelby49.6%
 
Other0.1%


HenrySowell29.3%
 
Shelby70.7%
 
Other0.0%


HoustonSowell22.5%
 
Shelby77.4%
 
Other0.1%


JacksonSowell37.2%
 
Shelby62.7%
 
Other0.1%


JeffersonSowell41.7%
 
Shelby58.2%
 
Other0.1%


LamarSowell26.8%
 
Shelby73.2%


LauderdaleSowell33.3%
 
Shelby66.6%
 
Other0.1%


LawrenceSowell38.5%
 
Shelby61.4%
 
Other0.1%


LeeSowell32.5%
 
Shelby67.5%


LimestoneSowell25.8%
 
Shelby74.1%
 
Other0.1%


LowndesSowell61.8%
 
Shelby38.1%
 
Other0.1%


MaconSowell74.6%
 
Shelby25.4%
 
Other0.1%


MadisonSowell31.8%
 
Shelby68.1%
 
Other0.1%


MarengoSowell42.3%
 
Shelby57.6%
 
Other0.0%


MarionSowell25.7%
 
Shelby74.1%
 
Other0.2%


MarshallSowell22.0%
 
Shelby77.9%
 
Other0.1%


MobileSowell37.0%
 
Shelby63.0%
 
Other0.0%


MonroeSowell35.5%
 
Shelby64.4%
 
Other0.1%


MontgomerySowell45.4%
 
Shelby54.6%
 
Other0.0%


MorganSowell24.6%
 
Shelby75.3%
 
Other0.2%


PerrySowell62.7%
 
Shelby37.2%
 
Other0.1%


PickensSowell38.4%
 
Shelby61.6%


PikeSowell31.4%
 
Shelby68.5%
 
Other0.1%


RandolphSowell29.0%
 
Shelby70.9%
 
Other0.0%


RussellSowell47.5%
 
Shelby52.3%
 
Other0.2%


St. ClairSowell16.3%
 
Shelby83.5%
 
Other0.2%


ShelbySowell14.7%
 
Shelby85.1%
 
Other0.2%


SumterSowell66.1%
 
Shelby33.9%
 
Other0.0%


TalladegaSowell33.7%
 
Shelby66.2%
 
Other0.1%


TallapoosaSowell26.4%
 
Shelby73.5%
 
Other0.1%


TuscaloosaSowell30.9%
 
Shelby69.0%
 
Other0.1%


WalkerSowell28.8%
 
Shelby71.1%
 
Other0.1%


WashingtonSowell33.9%
 
Shelby65.9%
 
Other0.1%


WilcoxSowell62.7%
 
Shelby37.3%


WinstonSowell17.5%
 
Shelby82.4%
 
Other0.1%


National DataGraph for 2004 - Alabama Results for 2004

Login

Terms of Use - DCMA Policy - Privacy Policy and Cookies


© Dave Leip's Atlas of U.S. Elections, LLC 2019 All Rights Reserved