2004 Presidential General Election Data Graphs - Illinois
Note: The Google advertisement links below may advocate political positions that this site does not endorse.
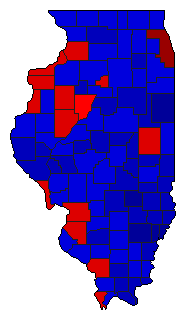
Map

AdamsKerry33.4%
 
Bush66.2%
 
Other0.4%


AlexanderKerry52.1%
 
Bush47.3%
 
Other0.7%


BondKerry43.8%
 
Bush55.2%
 
Other1.0%


BooneKerry42.4%
 
Bush57.0%
 
Other0.6%


BrownKerry34.6%
 
Bush65.0%
 
Other0.4%


BureauKerry44.5%
 
Bush54.9%
 
Other0.7%


CalhounKerry50.5%
 
Bush48.7%
 
Other0.8%


CarrollKerry43.5%
 
Bush55.7%
 
Other0.8%


CassKerry43.7%
 
Bush55.5%
 
Other0.8%


ChampaignKerry50.4%
 
Bush48.4%
 
Other1.2%


ChristianKerry40.0%
 
Bush59.2%
 
Other0.7%


ClarkKerry35.9%
 
Bush63.5%
 
Other0.6%


ClayKerry32.1%
 
Bush67.4%
 
Other0.6%


ClintonKerry39.7%
 
Bush59.7%
 
Other0.7%


ColesKerry42.0%
 
Bush57.1%
 
Other0.9%


CookKerry70.2%
 
Bush29.1%
 
Other0.6%


CrawfordKerry34.2%
 
Bush65.2%
 
Other0.6%


CumberlandKerry34.4%
 
Bush64.6%
 
Other1.1%


DeKalbKerry47.3%
 
Bush51.7%
 
Other1.0%


De WittKerry36.4%
 
Bush63.1%
 
Other0.5%


DouglasKerry32.4%
 
Bush66.8%
 
Other0.8%


DuPageKerry44.8%
 
Bush54.4%
 
Other0.9%


EdgarKerry36.7%
 
Bush62.4%
 
Other0.9%


EdwardsKerry27.6%
 
Bush71.7%
 
Other0.7%


EffinghamKerry27.0%
 
Bush72.3%
 
Other0.7%


FayetteKerry37.4%
 
Bush61.6%
 
Other1.0%


FordKerry29.5%
 
Bush69.6%
 
Other0.9%


FranklinKerry45.6%
 
Bush53.7%
 
Other0.8%


FultonKerry53.3%
 
Bush45.9%
 
Other0.8%


GallatinKerry48.8%
 
Bush50.2%
 
Other1.0%


GreeneKerry40.5%
 
Bush58.7%
 
Other0.9%


GrundyKerry42.7%
 
Bush56.5%
 
Other0.9%


HamiltonKerry40.2%
 
Bush58.8%
 
Other1.0%


HancockKerry40.2%
 
Bush59.0%
 
Other0.9%


HardinKerry37.9%
 
Bush61.6%
 
Other0.5%


HendersonKerry54.6%
 
Bush44.7%
 
Other0.7%


HenryKerry47.1%
 
Bush52.3%
 
Other0.6%


IroquoisKerry27.7%
 
Bush71.7%
 
Other0.6%


JacksonKerry55.4%
 
Bush43.3%
 
Other1.3%


JasperKerry33.4%
 
Bush66.1%
 
Other0.5%


JeffersonKerry39.6%
 
Bush59.9%
 
Other0.4%


JerseyKerry45.3%
 
Bush53.6%
 
Other1.0%


Jo DaviessKerry45.8%
 
Bush53.3%
 
Other0.9%


JohnsonKerry30.9%
 
Bush68.2%
 
Other0.9%


KaneKerry44.1%
 
Bush55.0%
 
Other0.8%


KankakeeKerry44.4%
 
Bush54.9%
 
Other0.7%


KendallKerry38.4%
 
Bush60.8%
 
Other0.8%


KnoxKerry54.2%
 
Bush45.0%
 
Other0.8%


LakeKerry48.8%
 
Bush50.5%
 
Other0.7%


LaSalleKerry47.8%
 
Bush51.5%
 
Other0.7%


LawrenceKerry37.4%
 
Bush61.9%
 
Other0.7%


LeeKerry40.4%
 
Bush58.6%
 
Other1.0%


LivingstonKerry35.1%
 
Bush64.3%
 
Other0.6%


LoganKerry31.7%
 
Bush67.7%
 
Other0.6%


McDonoughKerry47.7%
 
Bush51.3%
 
Other1.0%


McHenryKerry39.3%
 
Bush59.7%
 
Other0.9%


McLeanKerry41.7%
 
Bush57.6%
 
Other0.7%


MaconKerry45.1%
 
Bush54.3%
 
Other0.6%


MacoupinKerry49.1%
 
Bush50.1%
 
Other0.8%


MadisonKerry51.3%
 
Bush48.0%
 
Other0.7%


MarionKerry44.7%
 
Bush54.7%
 
Other0.7%


MarshallKerry42.6%
 
Bush56.7%
 
Other0.7%


MasonKerry44.8%
 
Bush54.4%
 
Other0.8%


MassacKerry37.8%
 
Bush61.7%
 
Other0.6%


MenardKerry32.5%
 
Bush67.1%
 
Other0.4%


MercerKerry50.3%
 
Bush49.1%
 
Other0.6%


MonroeKerry41.5%
 
Bush57.8%
 
Other0.7%


MontgomeryKerry46.2%
 
Bush53.0%
 
Other0.8%


MorganKerry37.2%
 
Bush61.9%
 
Other0.9%


MoultrieKerry36.9%
 
Bush62.3%
 
Other0.8%


OgleKerry37.4%
 
Bush61.9%
 
Other0.6%


PeoriaKerry49.7%
 
Bush49.6%
 
Other0.7%


PerryKerry45.8%
 
Bush53.6%
 
Other0.6%


PiattKerry36.4%
 
Bush62.8%
 
Other0.8%


PikeKerry35.7%
 
Bush63.1%
 
Other1.2%


PopeKerry37.7%
 
Bush61.6%
 
Other0.7%


PulaskiKerry44.1%
 
Bush55.3%
 
Other0.5%


PutnamKerry50.8%
 
Bush48.4%
 
Other0.7%


RandolphKerry45.3%
 
Bush54.0%
 
Other0.7%


RichlandKerry32.6%
 
Bush66.5%
 
Other0.9%


Rock IslandKerry57.0%
 
Bush42.4%
 
Other0.6%


St. ClairKerry55.1%
 
Bush44.4%
 
Other0.5%


SalineKerry39.8%
 
Bush59.7%
 
Other0.5%


SangamonKerry40.5%
 
Bush58.6%
 
Other0.9%


SchuylerKerry39.5%
 
Bush59.6%
 
Other0.8%


ScottKerry35.2%
 
Bush64.3%
 
Other0.5%


ShelbyKerry35.4%
 
Bush63.8%
 
Other0.8%


StarkKerry38.8%
 
Bush60.1%
 
Other1.0%


StephensonKerry41.8%
 
Bush57.3%
 
Other0.9%


TazewellKerry41.4%
 
Bush57.8%
 
Other0.7%


UnionKerry41.0%
 
Bush58.5%
 
Other0.6%


VermilionKerry43.7%
 
Bush55.6%
 
Other0.8%


WabashKerry29.2%
 
Bush70.1%
 
Other0.7%


WarrenKerry46.6%
 
Bush52.9%
 
Other0.5%


WashingtonKerry36.8%
 
Bush62.6%
 
Other0.6%


WayneKerry25.8%
 
Bush73.6%
 
Other0.6%


WhiteKerry37.0%
 
Bush62.4%
 
Other0.6%


WhitesideKerry51.1%
 
Bush48.2%
 
Other0.7%


WillKerry46.9%
 
Bush52.4%
 
Other0.7%


WilliamsonKerry39.0%
 
Bush60.4%
 
Other0.6%


WinnebagoKerry49.2%
 
Bush50.1%
 
Other0.7%


WoodfordKerry31.9%
 
Bush67.5%
 
Other0.5%


National DataGraph for 2004 - Illinois Results for 2004

Login

Terms of Use - DCMA Policy - Privacy Policy and Cookies


© Dave Leip's Atlas of U.S. Elections, LLC 2019 All Rights Reserved