2004 Presidential General Election Data Graphs - North Carolina
Note: The Google advertisement links below may advocate political positions that this site does not endorse.
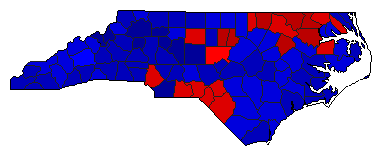
Map

AlamanceKerry38.2%
 
Bush61.5%
 
Other0.3%


AlexanderKerry29.6%
 
Bush70.1%
 
Other0.3%


AlleghanyKerry39.8%
 
Bush59.7%
 
Other0.5%


AnsonKerry58.7%
 
Bush41.1%
 
Other0.2%


AsheKerry37.9%
 
Bush61.7%
 
Other0.5%


AveryKerry24.0%
 
Bush75.5%
 
Other0.5%


BeaufortKerry36.0%
 
Bush63.7%
 
Other0.3%


BertieKerry61.5%
 
Bush38.1%
 
Other0.5%


BladenKerry49.6%
 
Bush50.1%
 
Other0.2%


BrunswickKerry39.2%
 
Bush60.4%
 
Other0.4%


BuncombeKerry49.4%
 
Bush50.0%
 
Other0.6%


BurkeKerry38.1%
 
Bush61.5%
 
Other0.4%


CabarrusKerry32.6%
 
Bush67.0%
 
Other0.4%


CaldwellKerry31.9%
 
Bush67.6%
 
Other0.5%


CamdenKerry35.0%
 
Bush64.8%
 
Other0.3%


CarteretKerry30.2%
 
Bush69.3%
 
Other0.5%


CaswellKerry48.1%
 
Bush51.6%
 
Other0.3%


CatawbaKerry32.1%
 
Bush67.5%
 
Other0.4%


ChathamKerry49.8%
 
Bush49.7%
 
Other0.5%


CherokeeKerry32.5%
 
Bush67.1%
 
Other0.4%


ChowanKerry44.7%
 
Bush55.1%
 
Other0.2%


ClayKerry33.5%
 
Bush65.9%
 
Other0.6%


ClevelandKerry38.3%
 
Bush61.4%
 
Other0.3%


ColumbusKerry48.8%
 
Bush50.8%
 
Other0.4%


CravenKerry37.1%
 
Bush62.4%
 
Other0.4%


CumberlandKerry48.1%
 
Bush51.6%
 
Other0.3%


CurrituckKerry32.4%
 
Bush67.0%
 
Other0.6%


DareKerry39.5%
 
Bush60.1%
 
Other0.4%


DavidsonKerry28.9%
 
Bush70.7%
 
Other0.4%


DavieKerry25.4%
 
Bush74.2%
 
Other0.4%


DuplinKerry41.7%
 
Bush58.0%
 
Other0.3%


DurhamKerry68.0%
 
Bush31.6%
 
Other0.5%


EdgecombeKerry61.1%
 
Bush38.7%
 
Other0.2%


ForsythKerry45.5%
 
Bush54.1%
 
Other0.4%


FranklinKerry44.4%
 
Bush55.2%
 
Other0.4%


GastonKerry31.8%
 
Bush67.8%
 
Other0.4%


GatesKerry52.3%
 
Bush47.5%
 
Other0.2%


GrahamKerry31.9%
 
Bush67.5%
 
Other0.6%


GranvilleKerry48.7%
 
Bush51.0%
 
Other0.3%


GreeneKerry41.2%
 
Bush58.7%
 
Other0.1%


GuilfordKerry50.2%
 
Bush49.3%
 
Other0.5%


HalifaxKerry58.7%
 
Bush41.2%
 
Other0.2%


HarnettKerry35.5%
 
Bush64.2%
 
Other0.3%


HaywoodKerry43.3%
 
Bush56.1%
 
Other0.6%


HendersonKerry34.7%
 
Bush64.8%
 
Other0.5%


HertfordKerry63.2%
 
Bush36.2%
 
Other0.6%


HokeKerry52.3%
 
Bush47.4%
 
Other0.3%


HydeKerry45.7%
 
Bush53.9%
 
Other0.4%


IredellKerry31.7%
 
Bush67.9%
 
Other0.4%


JacksonKerry47.5%
 
Bush51.9%
 
Other0.6%


JohnstonKerry31.8%
 
Bush67.9%
 
Other0.3%


JonesKerry41.9%
 
Bush57.8%
 
Other0.3%


LeeKerry39.2%
 
Bush60.6%
 
Other0.3%


LenoirKerry44.0%
 
Bush55.8%
 
Other0.1%


LincolnKerry31.9%
 
Bush67.8%
 
Other0.3%


McDowellKerry33.3%
 
Bush66.2%
 
Other0.5%


MaconKerry36.5%
 
Bush62.9%
 
Other0.6%


MadisonKerry44.7%
 
Bush54.7%
 
Other0.6%


MartinKerry48.8%
 
Bush51.0%
 
Other0.2%


MecklenburgKerry51.6%
 
Bush48.0%
 
Other0.4%


MitchellKerry26.7%
 
Bush72.9%
 
Other0.4%


MontgomeryKerry42.8%
 
Bush57.0%
 
Other0.2%


MooreKerry35.3%
 
Bush64.4%
 
Other0.3%


NashKerry41.7%
 
Bush58.1%
 
Other0.2%


New HanoverKerry43.8%
 
Bush55.8%
 
Other0.4%


NorthamptonKerry63.7%
 
Bush36.2%
 
Other0.1%


OnslowKerry30.2%
 
Bush69.5%
 
Other0.4%


OrangeKerry66.9%
 
Bush32.4%
 
Other0.7%


PamlicoKerry38.7%
 
Bush60.9%
 
Other0.4%


PasquotankKerry51.2%
 
Bush48.4%
 
Other0.4%


PenderKerry41.0%
 
Bush58.7%
 
Other0.3%


PerquimansKerry39.8%
 
Bush59.8%
 
Other0.4%


PersonKerry40.7%
 
Bush59.0%
 
Other0.3%


PittKerry46.5%
 
Bush53.3%
 
Other0.2%


PolkKerry42.0%
 
Bush57.0%
 
Other1.0%


RandolphKerry25.5%
 
Bush74.2%
 
Other0.3%


RichmondKerry51.9%
 
Bush47.7%
 
Other0.3%


RobesonKerry52.8%
 
Bush47.0%
 
Other0.3%


RockinghamKerry38.6%
 
Bush61.1%
 
Other0.3%


RowanKerry32.3%
 
Bush67.3%
 
Other0.4%


RutherfordKerry33.2%
 
Bush66.3%
 
Other0.5%


SampsonKerry43.3%
 
Bush56.5%
 
Other0.2%


ScotlandKerry55.3%
 
Bush44.5%
 
Other0.2%


StanlyKerry29.9%
 
Bush69.7%
 
Other0.3%


StokesKerry29.7%
 
Bush70.0%
 
Other0.3%


SurryKerry31.9%
 
Bush67.7%
 
Other0.4%


SwainKerry48.0%
 
Bush51.4%
 
Other0.6%


TransylvaniaKerry39.1%
 
Bush60.2%
 
Other0.7%


TyrrellKerry46.0%
 
Bush53.8%
 
Other0.3%


UnionKerry29.5%
 
Bush70.2%
 
Other0.3%


VanceKerry55.9%
 
Bush43.9%
 
Other0.2%


WakeKerry48.7%
 
Bush50.8%
 
Other0.5%


WarrenKerry64.4%
 
Bush35.4%
 
Other0.2%


WashingtonKerry54.3%
 
Bush45.4%
 
Other0.3%


WataugaKerry46.7%
 
Bush52.6%
 
Other0.7%


WayneKerry37.6%
 
Bush62.1%
 
Other0.2%


WilkesKerry29.0%
 
Bush70.7%
 
Other0.3%


WilsonKerry46.5%
 
Bush53.3%
 
Other0.2%


YadkinKerry22.5%
 
Bush77.2%
 
Other0.3%


YanceyKerry47.0%
 
Bush52.4%
 
Other0.6%


National DataGraph for 2004 - North Carolina Results for 2004

Login

Terms of Use - DCMA Policy - Privacy Policy and Cookies


© Dave Leip's Atlas of U.S. Elections, LLC 2019 All Rights Reserved