2006 State Treasurer General Election Data Graphs - California
Note: The Google advertisement links below may advocate political positions that this site does not endorse.
Data for this Contest was Contributed by on 2007-01-04
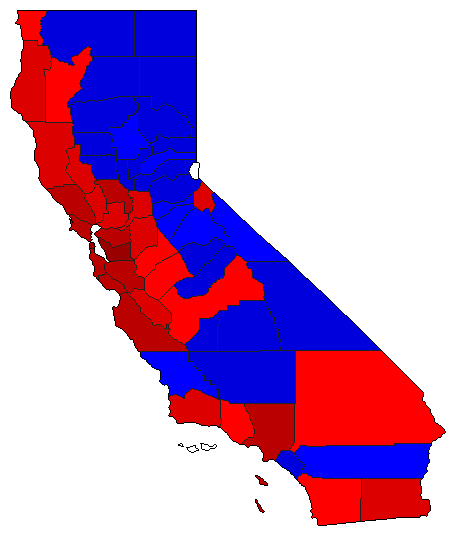
Map

AlamedaLockyer72.4%
 
Parrish18.9%
 
Other8.7%


AlpineLockyer50.6%
 
Parrish37.0%
 
Other12.5%


AmadorLockyer42.5%
 
Parrish49.0%
 
Other8.5%


ButteLockyer43.2%
 
Parrish46.6%
 
Other10.3%


CalaverasLockyer41.3%
 
Parrish48.4%
 
Other10.3%


ColusaLockyer40.0%
 
Parrish54.0%
 
Other6.0%


Contra CostaLockyer61.7%
 
Parrish31.9%
 
Other6.4%


Del NorteLockyer46.4%
 
Parrish43.1%
 
Other10.5%


El DoradoLockyer38.9%
 
Parrish51.9%
 
Other9.3%


FresnoLockyer46.2%
 
Parrish46.1%
 
Other7.7%


GlennLockyer37.1%
 
Parrish55.4%
 
Other7.5%


HumboldtLockyer53.6%
 
Parrish32.7%
 
Other13.7%


ImperialLockyer56.4%
 
Parrish34.6%
 
Other8.9%


InyoLockyer40.1%
 
Parrish50.1%
 
Other9.9%


KernLockyer38.5%
 
Parrish53.7%
 
Other7.8%


KingsLockyer42.7%
 
Parrish50.1%
 
Other7.2%


LakeLockyer53.2%
 
Parrish35.8%
 
Other11.0%


LassenLockyer35.7%
 
Parrish54.0%
 
Other10.3%


Los AngelesLockyer61.9%
 
Parrish29.9%
 
Other8.2%


MaderaLockyer38.7%
 
Parrish53.8%
 
Other7.5%


MarinLockyer68.8%
 
Parrish22.9%
 
Other8.3%


MariposaLockyer40.8%
 
Parrish50.1%
 
Other9.0%


MendocinoLockyer59.8%
 
Parrish26.6%
 
Other13.7%


MercedLockyer49.8%
 
Parrish42.4%
 
Other7.8%


ModocLockyer32.0%
 
Parrish56.7%
 
Other11.2%


MonoLockyer44.2%
 
Parrish44.4%
 
Other11.4%


MontereyLockyer60.2%
 
Parrish31.9%
 
Other7.9%


NapaLockyer57.9%
 
Parrish33.3%
 
Other8.8%


NevadaLockyer44.1%
 
Parrish46.3%
 
Other9.6%


OrangeLockyer39.3%
 
Parrish52.2%
 
Other8.5%


PlacerLockyer40.0%
 
Parrish52.2%
 
Other7.8%


PlumasLockyer40.5%
 
Parrish50.6%
 
Other8.9%


RiversideLockyer44.4%
 
Parrish47.8%
 
Other7.9%


SacramentoLockyer52.0%
 
Parrish39.4%
 
Other8.6%


San BenitoLockyer55.2%
 
Parrish35.9%
 
Other8.8%


San BernardinoLockyer46.9%
 
Parrish44.6%
 
Other8.5%


San DiegoLockyer47.6%
 
Parrish44.4%
 
Other8.1%


San FranciscoLockyer76.2%
 
Parrish12.8%
 
Other11.1%


San JoaquinLockyer51.0%
 
Parrish40.7%
 
Other8.3%


San Luis ObispoLockyer45.0%
 
Parrish46.7%
 
Other8.3%


San MateoLockyer66.5%
 
Parrish26.1%
 
Other7.5%


Santa BarbaraLockyer50.9%
 
Parrish39.7%
 
Other9.5%


Santa ClaraLockyer61.2%
 
Parrish29.5%
 
Other9.3%


Santa CruzLockyer67.4%
 
Parrish21.8%
 
Other10.7%


ShastaLockyer37.6%
 
Parrish54.4%
 
Other8.1%


SierraLockyer35.4%
 
Parrish51.5%
 
Other13.1%


SiskiyouLockyer40.3%
 
Parrish50.1%
 
Other9.6%


SolanoLockyer59.6%
 
Parrish32.9%
 
Other7.5%


SonomaLockyer63.8%
 
Parrish25.7%
 
Other10.5%


StanislausLockyer48.5%
 
Parrish44.9%
 
Other6.5%


SutterLockyer38.1%
 
Parrish54.7%
 
Other7.2%


TehamaLockyer39.1%
 
Parrish52.4%
 
Other8.5%


TrinityLockyer45.2%
 
Parrish40.8%
 
Other13.9%


TulareLockyer38.5%
 
Parrish55.5%
 
Other6.1%


TuolumneLockyer42.5%
 
Parrish48.1%
 
Other9.4%


VenturaLockyer48.6%
 
Parrish43.6%
 
Other7.8%


YoloLockyer60.6%
 
Parrish31.2%
 
Other8.2%


YubaLockyer37.2%
 
Parrish51.9%
 
Other10.8%


National DataGraph for 2006 - California Results for 2006

Login

Terms of Use - DCMA Policy - Privacy Policy and Cookies


© Dave Leip's Atlas of U.S. Elections, LLC 2019 All Rights Reserved