2007 Attorney General General Election Data Graphs - Louisiana
Note: The Google advertisement links below may advocate political positions that this site does not endorse.
Data for this Contest was Contributed by on 2007-11-18
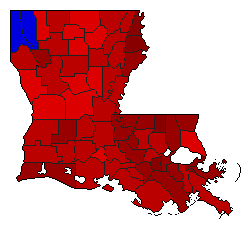
Map

AcadiaCaldwell63.2%
 
Alexander36.8%


AllenCaldwell73.6%
 
Alexander26.4%


AscensionCaldwell67.7%
 
Alexander32.3%


AssumptionCaldwell79.4%
 
Alexander20.6%


AvoyellesCaldwell69.2%
 
Alexander30.8%


BeauregardCaldwell62.3%
 
Alexander37.7%


BienvilleCaldwell67.1%
 
Alexander32.9%


BossierCaldwell45.3%
 
Alexander54.7%


CaddoCaldwell45.4%
 
Alexander54.6%


CalcasieuCaldwell66.4%
 
Alexander33.6%


CaldwellCaldwell65.1%
 
Alexander34.9%


CameronCaldwell72.9%
 
Alexander27.1%


CatahoulaCaldwell63.7%
 
Alexander36.3%


ClaiborneCaldwell63.4%
 
Alexander36.6%


ConcordiaCaldwell62.8%
 
Alexander37.2%


De SotoCaldwell65.1%
 
Alexander34.9%


East Baton RougeCaldwell69.7%
 
Alexander30.3%


East CarrollCaldwell81.5%
 
Alexander18.5%


East FelicianaCaldwell75.2%
 
Alexander24.8%


EvangelineCaldwell69.3%
 
Alexander30.7%


FranklinCaldwell67.5%
 
Alexander32.5%


GrantCaldwell58.3%
 
Alexander41.7%


IberiaCaldwell64.3%
 
Alexander35.7%


IbervilleCaldwell73.8%
 
Alexander26.2%


JacksonCaldwell57.1%
 
Alexander42.9%


JeffersonCaldwell67.5%
 
Alexander32.5%


Jefferson DavisCaldwell67.2%
 
Alexander32.8%


LafayetteCaldwell58.1%
 
Alexander41.9%


LafourcheCaldwell73.0%
 
Alexander27.0%


La SalleCaldwell51.4%
 
Alexander48.6%


LincolnCaldwell57.6%
 
Alexander42.4%


LivingstonCaldwell62.3%
 
Alexander37.7%


MadisonCaldwell80.1%
 
Alexander19.9%


MorehouseCaldwell64.2%
 
Alexander35.8%


NatchitochesCaldwell60.1%
 
Alexander39.9%


OrleansCaldwell80.9%
 
Alexander19.1%


OuachitaCaldwell56.4%
 
Alexander43.6%


PlaqueminesCaldwell60.8%
 
Alexander39.2%


Pointe CoupeeCaldwell78.1%
 
Alexander21.9%


RapidesCaldwell55.6%
 
Alexander44.4%


Red RiverCaldwell70.1%
 
Alexander29.9%


RichlandCaldwell66.7%
 
Alexander33.3%


SabineCaldwell58.1%
 
Alexander41.9%


St. BernardCaldwell75.5%
 
Alexander24.5%


St. CharlesCaldwell70.2%
 
Alexander29.8%


St. HelenaCaldwell82.9%
 
Alexander17.1%


St. JamesCaldwell80.5%
 
Alexander19.5%


St. John the BaptistCaldwell74.6%
 
Alexander25.4%


St. LandryCaldwell69.4%
 
Alexander30.6%


St. MartinCaldwell69.6%
 
Alexander30.4%


St. MaryCaldwell66.7%
 
Alexander33.3%


St. TammanyCaldwell58.4%
 
Alexander41.6%


TangipahoaCaldwell73.0%
 
Alexander27.0%


TensasCaldwell70.4%
 
Alexander29.6%


TerrebonneCaldwell66.1%
 
Alexander33.9%


UnionCaldwell52.2%
 
Alexander47.8%


VermilionCaldwell61.8%
 
Alexander38.2%


VernonCaldwell58.9%
 
Alexander41.1%


WashingtonCaldwell73.5%
 
Alexander26.5%


WebsterCaldwell58.8%
 
Alexander41.2%


West Baton RougeCaldwell76.4%
 
Alexander23.6%


West CarrollCaldwell65.4%
 
Alexander34.6%


West FelicianaCaldwell73.4%
 
Alexander26.6%


WinnCaldwell60.4%
 
Alexander39.6%


National DataGraph for 2007 - Louisiana Results for 2007

Login

Terms of Use - DCMA Policy - Privacy Policy and Cookies


© Dave Leip's Atlas of U.S. Elections, LLC 2019 All Rights Reserved