2012 Lt. Gubernatorial Republican Primary Election Data Graphs - North Carolina
Note: The Google advertisement links below may advocate political positions that this site does not endorse.
Data for this Contest was Contributed by on 2013-02-13
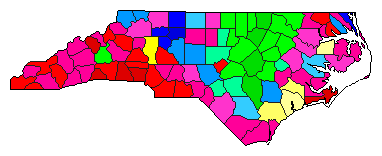
Map

AlamanceForest36.5%
 
Folwell22.9%
 
Gurley19.5%
 
Other21.1%


AlexanderForest38.3%
 
Folwell26.7%
 
Gurley16.7%
 
Other18.3%


AlleghanyForest22.9%
 
Folwell35.7%
 
Gurley24.9%
 
Other16.5%


AnsonForest43.4%
 
Folwell21.7%
 
Gurley15.3%
 
Other19.5%


AsheForest33.6%
 
Folwell37.3%
 
Gurley12.4%
 
Other16.6%


AveryForest41.1%
 
Folwell29.0%
 
Gurley13.7%
 
Other16.1%


BeaufortForest23.1%
 
Folwell25.9%
 
Gurley22.0%
 
Other28.9%


BertieForest29.1%
 
Folwell22.5%
 
Gurley19.3%
 
Other29.1%


BladenForest22.0%
 
Folwell23.2%
 
Gurley17.9%
 
Other36.9%


BrunswickForest31.3%
 
Folwell26.7%
 
Gurley16.8%
 
Other25.2%


BuncombeForest38.9%
 
Folwell19.7%
 
Gurley23.1%
 
Other18.3%


BurkeForest39.6%
 
Folwell26.2%
 
Gurley17.6%
 
Other16.6%


CabarrusForest38.8%
 
Folwell29.3%
 
Gurley14.7%
 
Other17.2%


CaldwellForest46.8%
 
Folwell20.6%
 
Gurley16.6%
 
Other16.0%


CamdenForest35.3%
 
Folwell31.8%
 
Gurley15.6%
 
Other17.2%


CarteretForest50.8%
 
Folwell15.1%
 
Gurley13.5%
 
Other20.6%


CaswellForest28.5%
 
Folwell22.2%
 
Gurley23.6%
 
Other25.7%


CatawbaForest47.8%
 
Folwell18.0%
 
Gurley17.5%
 
Other16.7%


ChathamForest29.0%
 
Folwell18.6%
 
Gurley39.2%
 
Other13.1%


CherokeeForest43.3%
 
Folwell25.3%
 
Gurley12.0%
 
Other19.4%


ChowanForest37.7%
 
Folwell22.6%
 
Gurley18.4%
 
Other21.2%


ClayForest40.3%
 
Folwell29.0%
 
Gurley14.5%
 
Other16.2%


ClevelandForest53.3%
 
Folwell19.0%
 
Gurley12.1%
 
Other15.6%


ColumbusForest34.3%
 
Folwell19.1%
 
Gurley15.2%
 
Other31.3%


CravenForest38.5%
 
Folwell14.4%
 
Gurley17.8%
 
Other29.3%


CumberlandForest24.0%
 
Folwell24.1%
 
Gurley38.4%
 
Other13.6%


CurrituckForest28.5%
 
Folwell41.4%
 
Gurley11.4%
 
Other18.7%


DareForest39.0%
 
Folwell27.8%
 
Gurley14.6%
 
Other18.7%


DavidsonForest25.1%
 
Folwell31.9%
 
Gurley21.7%
 
Other21.3%


DavieForest25.7%
 
Folwell45.4%
 
Gurley15.4%
 
Other13.5%


DuplinForest19.5%
 
Folwell34.5%
 
Gurley22.8%
 
Other23.2%


DurhamForest25.6%
 
Folwell19.6%
 
Gurley41.5%
 
Other13.3%


EdgecombeForest19.5%
 
Folwell21.8%
 
Gurley46.8%
 
Other11.9%


ForsythForest13.3%
 
Folwell59.3%
 
Gurley14.5%
 
Other12.9%


FranklinForest23.4%
 
Folwell15.9%
 
Gurley51.5%
 
Other9.3%


GastonForest53.3%
 
Folwell17.6%
 
Gurley14.1%
 
Other15.0%


GatesForest42.6%
 
Folwell24.6%
 
Gurley15.0%
 
Other17.8%


GrahamForest33.7%
 
Folwell29.3%
 
Gurley14.7%
 
Other22.3%


GranvilleForest21.3%
 
Folwell15.4%
 
Gurley49.3%
 
Other14.0%


GreeneForest26.2%
 
Folwell18.5%
 
Gurley33.8%
 
Other21.5%


GuilfordForest37.2%
 
Folwell25.6%
 
Gurley17.0%
 
Other20.2%


HalifaxForest20.3%
 
Folwell20.2%
 
Gurley48.3%
 
Other11.2%


HarnettForest22.5%
 
Folwell19.5%
 
Gurley47.8%
 
Other10.2%


HaywoodForest34.3%
 
Folwell24.7%
 
Gurley20.4%
 
Other20.6%


HendersonForest40.0%
 
Folwell23.4%
 
Gurley16.9%
 
Other19.8%


HertfordForest33.9%
 
Folwell21.6%
 
Gurley23.5%
 
Other21.0%


HokeForest25.6%
 
Folwell20.4%
 
Gurley37.5%
 
Other16.5%


HydeForest26.9%
 
Folwell22.5%
 
Gurley19.2%
 
Other31.3%


IredellForest25.0%
 
Folwell15.0%
 
Gurley9.7%
 
Other50.3%


JacksonForest45.3%
 
Folwell21.2%
 
Gurley13.4%
 
Other20.1%


JohnstonForest17.1%
 
Folwell17.9%
 
Gurley55.8%
 
Other9.2%


JonesForest27.8%
 
Folwell14.5%
 
Gurley20.3%
 
Other37.4%


LeeForest45.0%
 
Folwell21.2%
 
Gurley26.4%
 
Other7.5%


LenoirForest35.1%
 
Folwell17.5%
 
Gurley26.2%
 
Other21.1%


LincolnForest49.7%
 
Folwell18.7%
 
Gurley14.5%
 
Other17.1%


McDowellForest26.1%
 
Folwell14.6%
 
Gurley43.8%
 
Other15.5%


MaconForest39.2%
 
Folwell29.8%
 
Gurley11.7%
 
Other19.3%


MadisonForest39.3%
 
Folwell22.5%
 
Gurley17.0%
 
Other21.3%


MartinForest27.9%
 
Folwell18.1%
 
Gurley27.6%
 
Other26.3%


MecklenburgForest48.4%
 
Folwell23.3%
 
Gurley11.8%
 
Other16.4%


MitchellForest37.8%
 
Folwell23.7%
 
Gurley22.4%
 
Other16.1%


MontgomeryForest26.8%
 
Folwell25.0%
 
Gurley21.6%
 
Other26.5%


MooreForest28.3%
 
Folwell31.0%
 
Gurley28.5%
 
Other12.2%


NashForest17.5%
 
Folwell23.7%
 
Gurley48.6%
 
Other10.1%


New HanoverForest31.0%
 
Folwell24.4%
 
Gurley16.8%
 
Other27.8%


NorthamptonForest24.6%
 
Folwell17.5%
 
Gurley43.0%
 
Other14.9%


OnslowForest24.6%
 
Folwell23.5%
 
Gurley19.2%
 
Other32.7%


OrangeForest28.1%
 
Folwell21.2%
 
Gurley36.6%
 
Other14.0%


PamlicoForest30.0%
 
Folwell21.5%
 
Gurley15.4%
 
Other33.0%


PasquotankForest31.3%
 
Folwell38.7%
 
Gurley13.4%
 
Other16.7%


PenderForest23.0%
 
Folwell29.2%
 
Gurley13.5%
 
Other34.4%


PerquimansForest40.6%
 
Folwell28.0%
 
Gurley14.6%
 
Other16.8%


PersonForest21.5%
 
Folwell17.9%
 
Gurley47.0%
 
Other13.6%


PittForest29.0%
 
Folwell22.0%
 
Gurley26.9%
 
Other22.2%


PolkForest56.3%
 
Folwell15.5%
 
Gurley12.2%
 
Other16.1%


RandolphForest24.7%
 
Folwell30.6%
 
Gurley22.1%
 
Other22.6%


RichmondForest33.9%
 
Folwell24.5%
 
Gurley16.7%
 
Other24.9%


RobesonForest29.9%
 
Folwell22.3%
 
Gurley26.1%
 
Other21.7%


RockinghamForest25.6%
 
Folwell25.6%
 
Gurley21.4%
 
Other27.4%


RowanForest41.8%
 
Folwell21.8%
 
Gurley15.7%
 
Other20.7%


RutherfordForest40.1%
 
Folwell20.4%
 
Gurley23.1%
 
Other16.4%


SampsonForest17.8%
 
Folwell16.5%
 
Gurley52.2%
 
Other13.5%


ScotlandForest32.1%
 
Folwell23.7%
 
Gurley18.4%
 
Other25.9%


StanlyForest33.8%
 
Folwell24.1%
 
Gurley20.5%
 
Other21.6%


StokesForest17.2%
 
Folwell40.6%
 
Gurley22.6%
 
Other19.6%


SurryForest29.3%
 
Folwell28.8%
 
Gurley22.9%
 
Other18.9%


SwainForest45.7%
 
Folwell22.1%
 
Gurley11.8%
 
Other20.5%


TransylvaniaForest35.4%
 
Folwell28.5%
 
Gurley18.9%
 
Other17.1%


TyrrellForest32.4%
 
Folwell18.9%
 
Gurley22.5%
 
Other26.1%


UnionForest47.3%
 
Folwell20.6%
 
Gurley14.0%
 
Other18.1%


VanceForest18.4%
 
Folwell22.4%
 
Gurley46.4%
 
Other12.8%


WakeForest25.2%
 
Folwell15.2%
 
Gurley49.8%
 
Other9.7%


WarrenForest20.7%
 
Folwell17.6%
 
Gurley50.1%
 
Other11.6%


WashingtonForest18.1%
 
Folwell24.7%
 
Gurley24.7%
 
Other32.4%


WataugaForest37.9%
 
Folwell32.1%
 
Gurley12.4%
 
Other17.6%


WayneForest25.3%
 
Folwell17.7%
 
Gurley47.6%
 
Other9.4%


WilkesForest29.3%
 
Folwell26.9%
 
Gurley27.2%
 
Other16.6%


WilsonForest25.0%
 
Folwell18.9%
 
Gurley46.9%
 
Other9.2%


YadkinForest16.3%
 
Folwell42.3%
 
Gurley25.4%
 
Other16.1%


YanceyForest55.7%
 
Folwell15.8%
 
Gurley16.4%
 
Other12.1%


National DataGraph for 2012 - North Carolina Results for 2012

Login

Terms of Use - DCMA Policy - Privacy Policy and Cookies


© Dave Leip's Atlas of U.S. Elections, LLC 2019 All Rights Reserved