2012 Presidential Republican Primary Election Data Graphs - South Carolina
Note: The Google advertisement links below may advocate political positions that this site does not endorse.
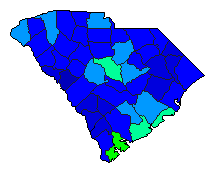
Map

AbbevilleHuntsman0.0%
 
Gingrich42.8%
 
Romney17.9%
 
Other39.2%


AikenHuntsman0.3%
 
Gingrich49.3%
 
Romney25.5%
 
Other24.9%


AllendaleHuntsman0.0%
 
Gingrich51.1%
 
Romney26.1%
 
Other22.7%


AndersonHuntsman0.1%
 
Gingrich43.6%
 
Romney21.6%
 
Other34.7%


BambergHuntsman0.2%
 
Gingrich51.5%
 
Romney26.4%
 
Other21.9%


BarnwellHuntsman0.1%
 
Gingrich54.9%
 
Romney22.5%
 
Other22.5%


BeaufortHuntsman0.5%
 
Gingrich35.3%
 
Romney43.0%
 
Other21.2%


BerkeleyHuntsman0.1%
 
Gingrich36.6%
 
Romney26.8%
 
Other36.5%


CalhounHuntsman0.2%
 
Gingrich44.5%
 
Romney25.2%
 
Other30.1%


CharlestonHuntsman0.3%
 
Gingrich32.6%
 
Romney36.0%
 
Other31.2%


CherokeeHuntsman0.1%
 
Gingrich42.1%
 
Romney18.9%
 
Other38.8%


ChesterHuntsman0.1%
 
Gingrich47.8%
 
Romney19.5%
 
Other32.6%


ChesterfieldHuntsman0.2%
 
Gingrich49.0%
 
Romney21.9%
 
Other28.9%


ClarendonHuntsman0.0%
 
Gingrich48.6%
 
Romney28.0%
 
Other23.4%


ColletonHuntsman0.2%
 
Gingrich47.2%
 
Romney22.5%
 
Other30.1%


DarlingtonHuntsman0.1%
 
Gingrich48.8%
 
Romney24.0%
 
Other27.1%


DillonHuntsman0.1%
 
Gingrich54.4%
 
Romney21.1%
 
Other24.4%


DorchesterHuntsman0.2%
 
Gingrich36.8%
 
Romney27.5%
 
Other35.6%


EdgefieldHuntsman0.1%
 
Gingrich60.3%
 
Romney18.5%
 
Other21.2%


FairfieldHuntsman0.1%
 
Gingrich41.4%
 
Romney29.0%
 
Other29.5%


FlorenceHuntsman0.2%
 
Gingrich51.3%
 
Romney23.7%
 
Other24.8%


GeorgetownHuntsman0.3%
 
Gingrich45.6%
 
Romney33.7%
 
Other20.5%


GreenvilleHuntsman0.2%
 
Gingrich39.7%
 
Romney25.4%
 
Other34.7%


GreenwoodHuntsman0.1%
 
Gingrich42.5%
 
Romney23.7%
 
Other33.6%


HamptonHuntsman0.1%
 
Gingrich50.8%
 
Romney23.3%
 
Other25.8%


HorryHuntsman0.2%
 
Gingrich45.7%
 
Romney30.0%
 
Other24.2%


JasperHuntsman0.3%
 
Gingrich46.6%
 
Romney28.9%
 
Other24.2%


KershawHuntsman0.1%
 
Gingrich37.9%
 
Romney30.9%
 
Other31.1%


LancasterHuntsman0.1%
 
Gingrich43.2%
 
Romney22.7%
 
Other34.0%


LaurensHuntsman0.2%
 
Gingrich41.8%
 
Romney20.0%
 
Other38.0%


LeeHuntsman0.1%
 
Gingrich45.0%
 
Romney24.3%
 
Other30.6%


LexingtonHuntsman0.2%
 
Gingrich36.5%
 
Romney30.7%
 
Other32.6%


McCormickHuntsman0.3%
 
Gingrich50.6%
 
Romney31.8%
 
Other17.3%


MarionHuntsman0.3%
 
Gingrich52.2%
 
Romney25.6%
 
Other21.8%


MarlboroHuntsman0.3%
 
Gingrich48.0%
 
Romney23.5%
 
Other28.2%


NewberryHuntsman0.2%
 
Gingrich42.8%
 
Romney28.5%
 
Other28.5%


OconeeHuntsman0.3%
 
Gingrich37.7%
 
Romney26.9%
 
Other35.1%


OrangeburgHuntsman0.1%
 
Gingrich47.1%
 
Romney26.0%
 
Other26.7%


PickensHuntsman0.2%
 
Gingrich42.0%
 
Romney21.0%
 
Other36.8%


RichlandHuntsman0.3%
 
Gingrich31.5%
 
Romney37.9%
 
Other30.2%


SaludaHuntsman0.1%
 
Gingrich47.4%
 
Romney23.7%
 
Other28.7%


SpartanburgHuntsman0.1%
 
Gingrich40.1%
 
Romney22.3%
 
Other37.6%


SumterHuntsman0.1%
 
Gingrich39.3%
 
Romney32.0%
 
Other28.6%


UnionHuntsman0.2%
 
Gingrich45.5%
 
Romney17.3%
 
Other36.9%


WilliamsburgHuntsman0.1%
 
Gingrich56.7%
 
Romney22.1%
 
Other21.1%


YorkHuntsman0.2%
 
Gingrich38.1%
 
Romney22.8%
 
Other38.9%


National DataGraph for 2012 - South Carolina Results for 2012

Login

Terms of Use - DCMA Policy - Privacy Policy and Cookies


© Dave Leip's Atlas of U.S. Elections, LLC 2019 All Rights Reserved