2012 Senatorial Republican Primary Election Data Graphs - Wisconsin
Note: The Google advertisement links below may advocate political positions that this site does not endorse.
Data for this Contest was Contributed by on 2012-12-09
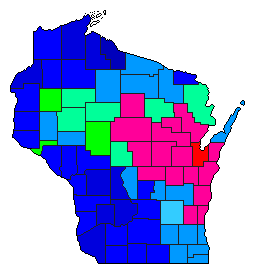
Map

AdamsHovde25.6%
 
Thompson38.3%
 
Neumann27.3%
 
Other8.9%


AshlandHovde9.9%
 
Thompson53.9%
 
Neumann31.2%
 
Other5.0%


BarronHovde14.1%
 
Thompson36.4%
 
Neumann45.1%
 
Other4.4%


BayfieldHovde9.1%
 
Thompson53.2%
 
Neumann34.0%
 
Other3.6%


BrownHovde45.0%
 
Thompson21.0%
 
Neumann26.2%
 
Other7.7%


BuffaloHovde21.8%
 
Thompson45.2%
 
Neumann29.5%
 
Other3.5%


BurnettHovde8.3%
 
Thompson54.3%
 
Neumann32.5%
 
Other4.9%


CalumetHovde37.3%
 
Thompson27.0%
 
Neumann25.7%
 
Other10.0%


ChippewaHovde24.7%
 
Thompson34.0%
 
Neumann37.4%
 
Other3.9%


ClarkHovde25.9%
 
Thompson26.6%
 
Neumann40.7%
 
Other6.8%


ColumbiaHovde26.8%
 
Thompson46.5%
 
Neumann20.7%
 
Other6.0%


CrawfordHovde18.0%
 
Thompson46.4%
 
Neumann29.6%
 
Other6.0%


DaneHovde32.9%
 
Thompson48.3%
 
Neumann15.2%
 
Other3.7%


DodgeHovde20.1%
 
Thompson29.9%
 
Neumann21.7%
 
Other28.3%


DoorHovde33.8%
 
Thompson34.0%
 
Neumann26.9%
 
Other5.3%


DouglasHovde11.5%
 
Thompson48.7%
 
Neumann35.7%
 
Other4.1%


DunnHovde21.2%
 
Thompson39.4%
 
Neumann34.2%
 
Other5.3%


Eau ClaireHovde24.8%
 
Thompson37.2%
 
Neumann33.5%
 
Other4.4%


FlorenceHovde18.5%
 
Thompson42.6%
 
Neumann29.9%
 
Other9.0%


Fond du LacHovde29.2%
 
Thompson32.4%
 
Neumann25.6%
 
Other12.8%


ForestHovde24.2%
 
Thompson36.5%
 
Neumann31.1%
 
Other8.2%


GrantHovde18.3%
 
Thompson54.2%
 
Neumann21.8%
 
Other5.8%


GreenHovde28.3%
 
Thompson44.4%
 
Neumann23.3%
 
Other3.9%


Green LakeHovde27.5%
 
Thompson36.7%
 
Neumann25.9%
 
Other9.9%


IowaHovde26.0%
 
Thompson49.1%
 
Neumann20.5%
 
Other4.4%


IronHovde8.8%
 
Thompson60.9%
 
Neumann25.5%
 
Other4.8%


JacksonHovde19.8%
 
Thompson44.3%
 
Neumann30.9%
 
Other5.0%


JeffersonHovde24.0%
 
Thompson34.3%
 
Neumann23.9%
 
Other17.9%


JuneauHovde17.9%
 
Thompson56.5%
 
Neumann20.0%
 
Other5.6%


KenoshaHovde25.5%
 
Thompson36.4%
 
Neumann25.0%
 
Other13.1%


KewauneeHovde39.8%
 
Thompson21.9%
 
Neumann31.2%
 
Other7.2%


La CrosseHovde22.4%
 
Thompson44.3%
 
Neumann28.8%
 
Other4.5%


LafayetteHovde21.5%
 
Thompson49.9%
 
Neumann24.7%
 
Other3.9%


LangladeHovde33.2%
 
Thompson25.2%
 
Neumann34.0%
 
Other7.6%


LincolnHovde32.7%
 
Thompson29.6%
 
Neumann28.0%
 
Other9.8%


ManitowocHovde39.7%
 
Thompson23.0%
 
Neumann27.3%
 
Other10.0%


MarathonHovde38.4%
 
Thompson26.8%
 
Neumann26.3%
 
Other8.6%


MarinetteHovde29.1%
 
Thompson28.2%
 
Neumann36.5%
 
Other6.3%


MarquetteHovde25.6%
 
Thompson45.0%
 
Neumann22.8%
 
Other6.6%


MenomineeHovde39.3%
 
Thompson24.3%
 
Neumann29.0%
 
Other7.5%


MilwaukeeHovde31.2%
 
Thompson33.9%
 
Neumann16.6%
 
Other18.4%


MonroeHovde16.2%
 
Thompson55.9%
 
Neumann23.0%
 
Other4.9%


OcontoHovde37.4%
 
Thompson23.1%
 
Neumann29.6%
 
Other9.9%


OneidaHovde30.3%
 
Thompson32.2%
 
Neumann30.7%
 
Other6.8%


OutagamieHovde39.6%
 
Thompson24.5%
 
Neumann27.8%
 
Other8.1%


OzaukeeHovde36.3%
 
Thompson32.6%
 
Neumann12.3%
 
Other18.9%


PepinHovde19.1%
 
Thompson34.7%
 
Neumann42.8%
 
Other3.4%


PierceHovde18.5%
 
Thompson44.6%
 
Neumann32.2%
 
Other4.6%


PolkHovde9.3%
 
Thompson46.8%
 
Neumann36.4%
 
Other7.5%


PortageHovde35.7%
 
Thompson27.8%
 
Neumann28.0%
 
Other8.5%


PriceHovde20.8%
 
Thompson36.7%
 
Neumann36.4%
 
Other6.1%


RacineHovde29.7%
 
Thompson30.2%
 
Neumann22.3%
 
Other17.7%


RichlandHovde16.4%
 
Thompson50.6%
 
Neumann28.1%
 
Other4.8%


RockHovde22.6%
 
Thompson43.5%
 
Neumann28.0%
 
Other5.9%


RuskHovde22.8%
 
Thompson35.4%
 
Neumann37.4%
 
Other4.5%


St. CroixHovde11.9%
 
Thompson47.5%
 
Neumann35.8%
 
Other4.9%


SaukHovde21.1%
 
Thompson53.8%
 
Neumann21.5%
 
Other3.6%


SawyerHovde11.2%
 
Thompson44.2%
 
Neumann40.7%
 
Other3.9%


ShawanoHovde34.9%
 
Thompson26.0%
 
Neumann30.4%
 
Other8.7%


SheboyganHovde39.2%
 
Thompson25.0%
 
Neumann22.5%
 
Other13.3%


TaylorHovde29.3%
 
Thompson27.7%
 
Neumann35.9%
 
Other7.1%


TrempealeauHovde22.6%
 
Thompson45.7%
 
Neumann27.3%
 
Other4.4%


VernonHovde21.8%
 
Thompson48.6%
 
Neumann24.1%
 
Other5.6%


VilasHovde26.3%
 
Thompson35.5%
 
Neumann31.7%
 
Other6.4%


WalworthHovde25.6%
 
Thompson34.9%
 
Neumann24.2%
 
Other15.4%


WashburnHovde11.5%
 
Thompson41.8%
 
Neumann41.5%
 
Other5.2%


WashingtonHovde34.3%
 
Thompson28.6%
 
Neumann15.4%
 
Other21.7%


WaukeshaHovde32.2%
 
Thompson33.3%
 
Neumann15.5%
 
Other19.0%


WaupacaHovde33.1%
 
Thompson29.1%
 
Neumann28.9%
 
Other8.9%


WausharaHovde32.8%
 
Thompson31.1%
 
Neumann25.5%
 
Other10.6%


WinnebagoHovde35.2%
 
Thompson29.6%
 
Neumann26.3%
 
Other8.8%


WoodHovde30.5%
 
Thompson27.0%
 
Neumann34.3%
 
Other8.2%


National DataGraph for 2012 - Wisconsin Results for 2012

Login

Terms of Use - DCMA Policy - Privacy Policy and Cookies


© Dave Leip's Atlas of U.S. Elections, LLC 2019 All Rights Reserved