2016 Senatorial General Election Data Graphs - North Carolina
Note: The Google advertisement links below may advocate political positions that this site does not endorse.
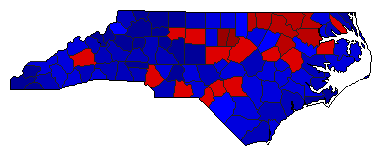
Map

AlamanceRoss40.9%
 
Burr55.8%
 
0.0%
 
Other3.4%


AlexanderRoss21.5%
 
Burr73.3%
 
0.0%
 
Other5.1%


AlleghanyRoss25.3%
 
Burr70.4%
 
0.0%
 
Other4.3%


AnsonRoss55.6%
 
Burr42.0%
 
0.0%
 
Other2.4%


AsheRoss26.8%
 
Burr69.4%
 
0.0%
 
Other3.8%


AveryRoss21.1%
 
Burr75.0%
 
0.0%
 
Other3.9%


BeaufortRoss35.7%
 
Burr60.6%
 
0.0%
 
Other3.7%


BertieRoss60.9%
 
Burr37.5%
 
0.0%
 
Other1.6%


BladenRoss44.8%
 
Burr52.7%
 
0.0%
 
Other2.5%


BrunswickRoss33.2%
 
Burr62.6%
 
0.0%
 
Other4.2%


BuncombeRoss55.2%
 
Burr40.8%
 
0.0%
 
Other4.0%


BurkeRoss29.9%
 
Burr65.5%
 
0.0%
 
Other4.6%


CabarrusRoss37.1%
 
Burr58.2%
 
0.0%
 
Other4.7%


CaldwellRoss23.8%
 
Burr71.1%
 
0.0%
 
Other5.1%


CamdenRoss26.3%
 
Burr70.0%
 
0.0%
 
Other3.7%


CarteretRoss25.9%
 
Burr70.0%
 
0.0%
 
Other4.1%


CaswellRoss42.7%
 
Burr54.8%
 
0.0%
 
Other2.5%


CatawbaRoss29.0%
 
Burr66.1%
 
0.0%
 
Other4.8%


ChathamRoss51.7%
 
Burr45.5%
 
0.0%
 
Other2.8%


CherokeeRoss23.2%
 
Burr73.2%
 
0.0%
 
Other3.5%


ChowanRoss40.9%
 
Burr57.2%
 
0.0%
 
Other1.9%


ClayRoss25.3%
 
Burr71.4%
 
0.0%
 
Other3.3%


ClevelandRoss34.1%
 
Burr62.3%
 
0.0%
 
Other3.6%


ColumbusRoss38.1%
 
Burr58.7%
 
0.0%
 
Other3.2%


CravenRoss36.5%
 
Burr59.7%
 
0.0%
 
Other3.8%


CumberlandRoss55.4%
 
Burr41.2%
 
0.0%
 
Other3.4%


CurrituckRoss24.3%
 
Burr72.3%
 
0.0%
 
Other3.4%


DareRoss37.6%
 
Burr59.3%
 
0.0%
 
Other3.1%


DavidsonRoss23.9%
 
Burr72.2%
 
0.0%
 
Other3.9%


DavieRoss23.7%
 
Burr72.0%
 
0.0%
 
Other4.3%


DuplinRoss39.0%
 
Burr58.4%
 
0.0%
 
Other2.6%


DurhamRoss75.9%
 
Burr21.7%
 
0.0%
 
Other2.3%


EdgecombeRoss64.3%
 
Burr33.9%
 
0.0%
 
Other1.8%


ForsythRoss50.6%
 
Burr46.3%
 
0.0%
 
Other3.1%


FranklinRoss42.7%
 
Burr53.9%
 
0.0%
 
Other3.4%


GastonRoss32.1%
 
Burr63.3%
 
0.0%
 
Other4.6%


GatesRoss44.0%
 
Burr53.6%
 
0.0%
 
Other2.4%


GrahamRoss21.9%
 
Burr73.7%
 
0.0%
 
Other4.4%


GranvilleRoss47.0%
 
Burr50.0%
 
0.0%
 
Other3.0%


GreeneRoss44.0%
 
Burr53.5%
 
0.0%
 
Other2.5%


GuilfordRoss56.5%
 
Burr40.5%
 
0.0%
 
Other3.0%


HalifaxRoss62.4%
 
Burr35.9%
 
0.0%
 
Other1.7%


HarnettRoss36.8%
 
Burr59.7%
 
0.0%
 
Other3.6%


HaywoodRoss36.2%
 
Burr59.0%
 
0.0%
 
Other4.9%


HendersonRoss34.4%
 
Burr61.7%
 
0.0%
 
Other3.9%


HertfordRoss67.5%
 
Burr31.3%
 
0.0%
 
Other1.2%


HokeRoss53.3%
 
Burr42.7%
 
0.0%
 
Other4.0%


HydeRoss41.8%
 
Burr54.8%
 
0.0%
 
Other3.4%


IredellRoss29.7%
 
Burr65.1%
 
0.0%
 
Other5.2%


JacksonRoss43.3%
 
Burr52.0%
 
0.0%
 
Other4.6%


JohnstonRoss33.2%
 
Burr63.3%
 
0.0%
 
Other3.5%


JonesRoss39.5%
 
Burr57.4%
 
0.0%
 
Other3.1%


LeeRoss41.9%
 
Burr54.6%
 
0.0%
 
Other3.5%


LenoirRoss46.5%
 
Burr51.1%
 
0.0%
 
Other2.4%


LincolnRoss24.8%
 
Burr70.4%
 
0.0%
 
Other4.8%


McDowellRoss25.1%
 
Burr70.0%
 
0.0%
 
Other4.9%


MaconRoss30.7%
 
Burr65.0%
 
0.0%
 
Other4.3%


MadisonRoss38.6%
 
Burr56.8%
 
0.0%
 
Other4.6%


MartinRoss48.0%
 
Burr49.3%
 
0.0%
 
Other2.7%


MecklenburgRoss59.2%
 
Burr37.1%
 
0.0%
 
Other3.7%


MitchellRoss21.6%
 
Burr74.9%
 
0.0%
 
Other3.5%


MontgomeryRoss36.8%
 
Burr59.8%
 
0.0%
 
Other3.5%


MooreRoss33.2%
 
Burr63.6%
 
0.0%
 
Other3.2%


NashRoss48.6%
 
Burr49.4%
 
0.0%
 
Other2.0%


New HanoverRoss44.5%
 
Burr50.9%
 
0.0%
 
Other4.6%


NorthamptonRoss62.4%
 
Burr36.1%
 
0.0%
 
Other1.5%


OnslowRoss30.3%
 
Burr64.5%
 
0.0%
 
Other5.2%


OrangeRoss70.7%
 
Burr26.7%
 
0.0%
 
Other2.5%


PamlicoRoss35.0%
 
Burr61.9%
 
0.0%
 
Other3.0%


PasquotankRoss50.2%
 
Burr47.3%
 
0.0%
 
Other2.6%


PenderRoss33.1%
 
Burr62.6%
 
0.0%
 
Other4.2%


PerquimansRoss34.7%
 
Burr63.3%
 
0.0%
 
Other2.0%


PersonRoss40.1%
 
Burr57.0%
 
0.0%
 
Other2.9%


PittRoss50.3%
 
Burr46.6%
 
0.0%
 
Other3.1%


PolkRoss37.1%
 
Burr59.4%
 
0.0%
 
Other3.6%


RandolphRoss20.6%
 
Burr75.1%
 
0.0%
 
Other4.3%


RichmondRoss44.7%
 
Burr51.6%
 
0.0%
 
Other3.7%


RobesonRoss48.1%
 
Burr49.9%
 
0.0%
 
Other2.0%


RockinghamRoss33.9%
 
Burr62.4%
 
0.0%
 
Other3.7%


RowanRoss30.2%
 
Burr64.7%
 
0.0%
 
Other5.1%


RutherfordRoss27.7%
 
Burr68.4%
 
0.0%
 
Other3.9%


SampsonRoss40.1%
 
Burr57.8%
 
0.0%
 
Other2.1%


ScotlandRoss52.8%
 
Burr45.1%
 
0.0%
 
Other2.1%


StanlyRoss24.5%
 
Burr70.3%
 
0.0%
 
Other5.3%


StokesRoss21.3%
 
Burr74.4%
 
0.0%
 
Other4.3%


SurryRoss23.6%
 
Burr72.7%
 
0.0%
 
Other3.7%


SwainRoss38.7%
 
Burr55.5%
 
0.0%
 
Other5.8%


TransylvaniaRoss38.2%
 
Burr57.9%
 
0.0%
 
Other3.9%


TyrrellRoss40.7%
 
Burr55.1%
 
0.0%
 
Other4.2%


UnionRoss30.8%
 
Burr65.0%
 
0.0%
 
Other4.2%


VanceRoss61.0%
 
Burr37.3%
 
0.0%
 
Other1.7%


WakeRoss55.3%
 
Burr41.5%
 
0.0%
 
Other3.2%


WarrenRoss64.8%
 
Burr33.3%
 
0.0%
 
Other1.9%


WashingtonRoss55.8%
 
Burr41.7%
 
0.0%
 
Other2.5%


WataugaRoss46.9%
 
Burr48.3%
 
0.0%
 
Other4.8%


WayneRoss42.5%
 
Burr54.9%
 
0.0%
 
Other2.6%


WilkesRoss21.8%
 
Burr73.9%
 
0.0%
 
Other4.3%


WilsonRoss51.3%
 
Burr46.6%
 
0.0%
 
Other2.1%


YadkinRoss18.0%
 
Burr78.2%
 
0.0%
 
Other3.8%


YanceyRoss36.0%
 
Burr60.2%
 
0.0%
 
Other3.8%


National DataGraph for 2016 - North Carolina Results for 2016

Login

Terms of Use - DCMA Policy - Privacy Policy and Cookies


© Dave Leip's Atlas of U.S. Elections, LLC 2019 All Rights Reserved