| |
Presidential
Candidate | Home State | Political
Party | Primary Vote | Delegates |
 | Rick Santorum | Virginia | Republican |
96,258 |
32.73% | 13 | 32.5% |
 | Newt Gingrich | Virginia | Republican |
91,612 |
31.15% | 12 | 30.0% |
 | Mitt Romney | Massachusetts | Republican |
90,161 |
30.66% | 12 | 30.0% |
 | Ron Paul | Texas | Republican |
12,955 |
4.40% | 0 | 0.0% |
 | Rick Perry | Texas | Republican |
1,350 |
0.46% | 0 | 0.0% |
| Michele Bachmann | Minnesota | Republican |
971 |
0.33% | 0 | 0.0% |
| Other (+) | - | Republican |
805 |
0.27% | 0 | 0% |
 | Unallocated | - | Republican |
- |
- | 3 | 7.5% |
 |
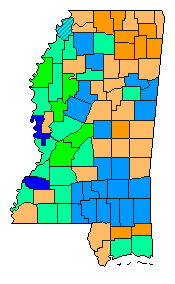
Map Key
| Turnout
 |  |  |
|
|
| | Election Information: | | Contest Type: | State-run Primary | | Election Date: | 2012-03-13 | | Eligible Participants: | Open (all voters) | | Delegates Awarded in this Contest: | 37 | | Delegates Total: | 40 | Statewide Delegates: Winner Take all if the top candidate receives a majority of votes or the top candidate is the only candidate to receive at least 15 percent of the vote, otherwise delegates are awarded proportionally to those candidates that receive more than 15 percent of the vote.
Congressional District Delegates: Winner Take all if Majority, otherwise top-vote getter wins two delegates and the candidate with the next highest number of votes receives one delegate |
|
| Demographic Data
| 2012 Population: | 2,984,599 | Est. | 2012 Population Density: | 24.6 | persons/km2 | | 2010 Population: | 2,967,297 | Enum. | 2010 Population Density: | 24.4 | persons/km2 | | Total Delegates: | 40 | | Delegates Density: | 74,615 | persons/Del | | Land Area (2000): | 121,488 | km2 | Annual Pop Growth Rate: | 0.3 | % |
| Election Data and Statistics:
| Election Tools
|
| |


