| |
Presidential
Candidate | Vice Presidential
Candidate | Political
Party | Popular Vote | Electoral Vote |
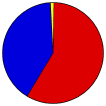
 | Barack H. Obama | Joseph R. Biden, Jr. | Democratic |
905,109 |
58.06% | 7 |
 | Willard Mitt Romney | Paul Ryan | Republican |
634,899 |
40.72% | 0 |
 | Gary Johnson | James P. Gray | Libertarian |
12,580 |
0.81% | 0 |
| Ross C. 'Rocky' Anderson | Luis J. Rodriguez | Independent |
5,487 |
0.35% | 0 |
| Other (+) | - | - |
918 |
0.06% | 0 |
 |
Map Key
| Turnout
 |  |  |
|
|
| Election Notes:
- Official Results list Obama as receiving 905,083 votes and Romney 634,892. Corrected figures in Waterbury (New Haven County) per Town Clerk
| Demographic Data
| 2012 Population: | 3,595,211 | Est. | 2012 Population Density: | 286.5 | persons/km2 | | 2010 Population: | 3,574,097 | Enum. | 2010 Population Density: | 284.8 | persons/km2 | | Total Electoral Vote: | 7 | | Electoral Vote Density: | 513,602 | persons/EV | | Land Area (2000): | 12,548 | km2 | Annual Pop Growth Rate: | 0.3 | % |
| Election Data and Statistics:
| Election Tools
- Atlas Forum Image Code for Maps: County, CD, Town, Pop, Tnd, Swg
Data Sources:
- Source for Popular Vote data: Connecticut Secretary of the State Election Services Division. Statement of Vote Presidential Electors For, Connecticut Secretary of the State Election Services Division (http://www.statementofvote-sots.ct.gov/StatementOfVote/WebModules/ReportsLink/OfficeTitle.aspx
) (accessed 02 Dec 2012)
- Source for Population data: U.S. Census Bureau.
| Results for and Individual County:
| | Primary Documentation:
|
| The 2012 Campaign:
|
|
| |


