| |
Presidential
Candidate | Home State | Political
Party | Primary Vote | Delegates |
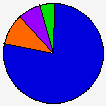
 | John McCain | Arizona | Republican |
320,308 |
77.62% | 27 | 47.4% |
 | Mike Huckabee | Arkansas | Republican |
41,173 |
9.98% | 0 | 0.0% |
 | Ron Paul | Texas | Republican |
31,611 |
7.66% | 0 | 0.0% |
 | Mitt Romney | Massachusetts | Republican |
19,581 |
4.74% | 0 | 0.0% |
 | Unallocated | - | Republican |
- |
- | 30 | 52.6% |
 |
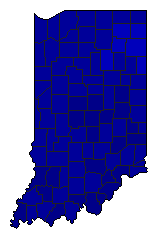
Map Key
| Turnout
 |  |  |
|
|
| | Election Information: | | Contest Type: | State-run Primary | | Election Date: | 2008-05-06 | | Eligible Participants: | Open (all voters) | | Delegates Awarded in this Contest: | 27 | | Delegates Total: | 57 | | Delegate Allocation Method: Winner-take-all by district and statewide |
- 27 district delegates: the candidate receiving the highest number of votes in each congressional district is awarded three delegates.
|
|
| Demographic Data
| 2010 Population: | 6,483,802 | Enum. | 2010 Population Density: | 69.8 | persons/km2 | | 2008 Population: | 6,424,806 | Est. | 2008 Population Density: | 69.2 | persons/km2 | | 2000 Population: | 6,080,485 | Enum. | 2000 Population Density: | 65.5 | persons/km2 | | Total Delegates: | 57 | | Delegates Density: | 112,716 | persons/Del | | Land Area (2000): | 92,895 | km2 | Annual Pop Growth Rate: | 0.6 | % |
| Election Data and Statistics:
| Election Tools
|
| |


