| |
Presidential
Candidate | Home State | Political
Party | Caucus Result | Delegates |
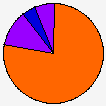
 | Tom Harkin | Iowa | Democratic |
2,314 |
77.24% | 0 | 0.0% |
 | Uncommitted | - | Democratic |
355 |
11.85% | 0 | 0.0% |
 | Paul E. Tsongas | Massachusetts | Democratic |
128 |
4.27% | 0 | 0.0% |
| William J. Clinton | Arkansas | Democratic |
76 |
2.54% | 0 | 0.0% |
| Robert Kerrey | Nebraska | Democratic |
72 |
2.40% | 0 | 0.0% |
| Edmund G. Brown | California | Democratic |
51 |
1.70% | 0 | 0.0% |
 |
Map Key
| Turnout
 |  |  |
|
| Maps | 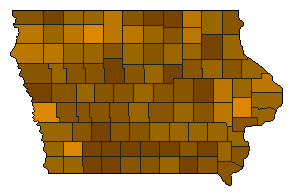 |  | | Pop. (m) | | Dem. (m) | | Dem. (m) |
| |
| | Election Information: | | Contest Type: | Party-run Caucus/Convention | | Caucus Date: | 1992-02-10 | | Eligible Participants: | Closed (only members of the party) | | Delegates Awarded in this Contest: | 0 | | Delegates Total: | 49 | | Delegate Allocation Method: Statewide Winner-take-all |
|
| Demographic Data
| 2000 Population: | 2,926,324 | Enum. | 2000 Population Density: | 20.2 | persons/km2 | | 1992 Population: | 2,818,401 | Est. | 1992 Population Density: | 19.5 | persons/km2 | | 1990 Population: | 2,776,831 | Enum. | 1990 Population Density: | 19.2 | persons/km2 | | Total Delegates: | 0 | | Delegates Density: | | persons/Del | | Land Area (2000): | 144,701 | km2 | Annual Pop Growth Rate: | 0.5 | % |
| Election Data and Statistics:
| Election Tools
|
| |


