Home
2024
Election Results
Election Info
Weblog
Forum
Wiki
Search
Email
Login
Site Info
Store
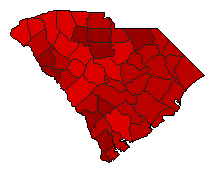
1968 Senatorial General Election Results - South Carolina
Note: The Google advertisement links below may advocate political positions that this site does not endorse.
Data for this Contest was Contributed by on 2012-02-06
Senatorial
Candidate
Political
Party
Popular Vote
Ernest F. Hollings
Democratic
404,060
61.89%
Marshall Parker
Republican
248,780
38.11%
Write-ins
-
15
0.00%
Map Key
> 40%
> 50%
> 60%
> 70%
Turnout
Maps
Demographic Data
1970 Population:
2,590,713
Enum.
1970 Population Density:
33.2
persons/km
2
1960 Population:
2,382,594
Enum.
1960 Population Density:
30.6
persons/km
2
Land Area (2000):
77,983
km
2
Annual Pop Growth Rate:
0.8
%
Election Data and Statistics:
County Data (Table)
(m)
County Data (Graphs)
Compare State Data by Year (Table)
Compare State Data by Year (Graphs)
View All 1968 South Carolina Data
Compare State Maps by Year
View All 1968 South Carolina Maps
Election Tools
Atlas Forum
Image Code for Maps:
County
Data Sources:
Source for Popular Vote data: South Carolina State Election Commission.
1968 Election Report
, South Carolina State Election Commission (http://www.scvotes.org/files/ElectionReports/Election_Report_1968.pdf) (accessed 06 Feb 2012)
Source for Population data: U.S. Census Bureau.
Results for and Individual County:
(m)
Choose Year
2022
2020
2016
2014
2014
2010
2008
2004
2002
1998
1996
1992
1990
1986
1984
1980
1978
1974
1972
1954
Choose Office
President
Choose State
Alabama
Alaska
Arizona
Arkansas
California
Colorado
Connecticut
Florida
Georgia
Hawaii
Idaho
Illinois
Indiana
Iowa
Kansas
Kentucky
Maryland
Missouri
Nevada
New Hampshire
New York
North Carolina
North Dakota
Oklahoma
Oregon
Pennsylvania
South Dakota
Utah
Vermont
Washington
Wisconsin
1990 >
South Carolina Election Results Home
-
National Results for 1968
-
Use Frame Navigation
Login
Terms of Use
-
DCMA Policy
-
Privacy Policy and Cookies
©
Dave Leip's Atlas of U.S. Elections, LLC 2019 All Rights Reserved


