Home
2024
Election Results
Election Info
Weblog
Forum
Wiki
Search
Email
Login
Site Info
Store
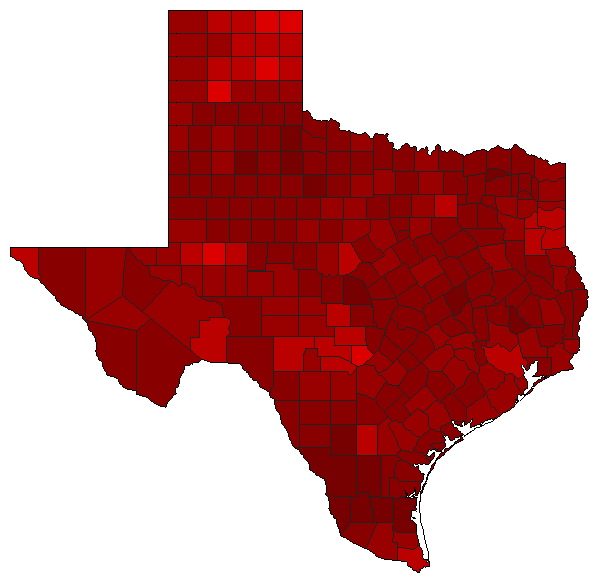
1964 Attorney General General Election Results - Texas
Note: The Google advertisement links below may advocate political positions that this site does not endorse.
Data for this Contest was Contributed by on 2011-01-23
Attorney General
Candidate
Political
Party
Popular Vote
Waggoner Carr
Democratic
1,901,038
74.75%
John Trice
Republican
642,134
25.25%
Map Key
> 50%
> 60%
> 70%
> 80%
> 90%
Turnout
Maps
Demographic Data
1970 Population:
11,198,655
Enum.
1970 Population Density:
16.5
persons/km
2
1960 Population:
9,579,677
Enum.
1960 Population Density:
14.1
persons/km
2
Land Area (2000):
678,051
km
2
Annual Pop Growth Rate:
1.6
%
Election Data and Statistics:
County Data (Table)
(m)
County Data (Graphs)
Compare State Data by Year (Table)
Compare State Data by Year (Graphs)
View All 1964 Texas Data
Compare State Maps by Year
View All 1964 Texas Maps
Election Tools
Atlas Forum
Image Code for Maps:
County
Data Sources:
Source for Popular Vote data: Texas Secretary of State, comp.,
Returns Of An Election Held November 3, 1964 For Statewide Offices
(Austin, 1964)
Source for Population data: U.S. Census Bureau.
Results for and Individual County:
(m)
Choose Year
2022
2018
2014
2010
2006
2002
1998
1994
1990
Choose Office
President
Senator
Governor
Choose State
Arizona
Iowa
Kansas
Massachusetts
Nebraska
New Mexico
North Dakota
Oregon
Rhode Island
South Dakota
Washington
Wisconsin
2022 >
Texas Election Results Home
-
National Results for 1964
-
Use Frame Navigation
Login
Terms of Use
-
DCMA Policy
-
Privacy Policy and Cookies
©
Dave Leip's Atlas of U.S. Elections, LLC 2019 All Rights Reserved


