Home
2024
Election Results
Election Info
Weblog
Forum
Wiki
Search
Email
Login
Site Info
Store
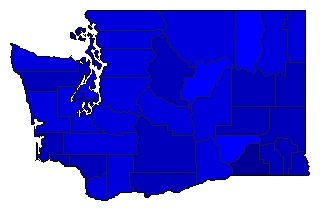
1920 Attorney General General Election Results - Washington
Note: The Google advertisement links below may advocate political positions that this site does not endorse.
Data for this Contest was Contributed by on 2008-01-17
Attorney General
Candidate
Political
Party
Popular Vote
L. L. Thompson
Republican
216,566
57.60%
James M. Phillips
Farmer-Labor
100,175
26.64%
John W. Hanna
Democratic
59,227
15.75%
Map Key
> 40%
> 50%
> 60%
> 70%
Turnout
Maps
Election Notes:
Data says Phillips got a total of 100,166 votes, but the county totals actually add up to 100,175.
Demographic Data
1920 Population:
1,356,621
Enum.
1920 Population Density:
7.9
persons/km
2
1910 Population:
1,141,990
Enum.
1910 Population Density:
6.6
persons/km
2
Land Area (2000):
172,348
km
2
Annual Pop Growth Rate:
1.7
%
Election Data and Statistics:
County Data (Table)
(m)
County Data (Graphs)
(m)
Compare State Data by Year (Table)
Compare State Data by Year (Graphs)
View All 1920 Washington Data
Compare State Maps by Year
View All 1920 Washington Maps
Election Tools
Atlas Forum
Image Code for Maps:
County
Data Sources:
Source for Popular Vote data: Washington Secretary of State, Comp,
Fourth Biennial Report
(Olympia, WA: Frank M. Lamborn, 1921)
Source for Population data: U.S. Census Bureau.
Results for and Individual County:
(m)
Choose Year
2020
2016
2012
2008
2004
2000
1996
1992
1988
1984
1980
1976
1972
1968
1964
1960
1956
1952
1948
1944
1940
1936
1932
1928
1924
1916
1912
1908
1904
1900
1896
1892
1889
Choose Office
President
Senator
Governor
Lt. Governor
Secretary of State
State Treasurer
Comptroller General
State Auditor
Insurance Commissioner
Choose State
Arizona
Colorado
Illinois
Washington Election Results Home
-
National Results for 1920
-
Use Frame Navigation
Login
Terms of Use
-
DCMA Policy
-
Privacy Policy and Cookies
©
Dave Leip's Atlas of U.S. Elections, LLC 2019 All Rights Reserved


