| |
Presidential
Candidate | Vice Presidential
Candidate | Political
Party | Popular Vote | Electoral Vote |
 | William Clinton | Albert Gore Jr. | Democratic |
1,871,182 |
43.77% | 18 |
 | George Bush | J. Danforth Quayle | Republican |
1,554,940 |
36.38% | 0 |
 | H. Ross Perot | James Stockdale | Independent |
824,813 |
19.30% | 0 |
 | Other (+) | - | - |
23,738 |
0.56% | 0 |
 |
Map Key
| Turnout
 |  |  |
|
| Maps | 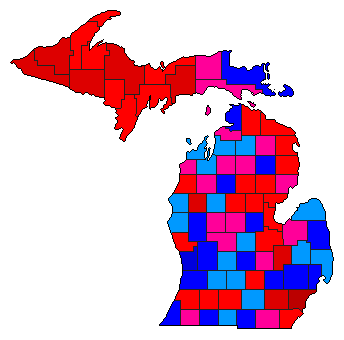 |  |  | | Pop. (m) | | Dem. (m) | | Rep. (m) | | Ind. (m) | | Swg (m) | | Tnd (m) |
| |
| Election Notes:
- Phillips party was listed on the ballot as Tisch Independent Citizens
| Demographic Data
| 2000 Population: | 9,938,444 | Enum. | 2000 Population Density: | 67.6 | persons/km2 | | 1992 Population: | 9,479,065 | Est. | 1992 Population Density: | 64.4 | persons/km2 | | 1990 Population: | 9,295,287 | Enum. | 1990 Population Density: | 63.2 | persons/km2 | | Total Electoral Vote: | 18 | | Electoral Vote Density: | 526,615 | persons/EV | | Land Area (2000): | 147,121 | km2 | Annual Pop Growth Rate: | 0.7 | % |
| Election Data and Statistics:
| Election Tools
- Atlas Forum Image Code for Maps: County, Pop, Tnd, Swg
Data Sources:
- Source for Popular Vote data: Michigan Legislative Service Bureau, comp., "Official Canvass of Votes, General Election November 3, 1992 President/Vice President," Michigan Manual 1993-1994 (Lansing, 1993)
- Source for Population data: U.S. Census Bureau.
| Results for and Individual County:
|
|
| |


