| |
Presidential
Candidate | Home State | Political
Party | Primary Vote | Delegates |
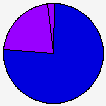
 | John McCain | Arizona | Republican |
72,791 |
76.04% | 0 | 0.0% |
 | Ron Paul | Texas | Republican |
20,606 |
21.53% | 0 | 0.0% |
| Uncommitted | - | Republican |
2,333 |
2.44% | 0 | 0.0% |
 |
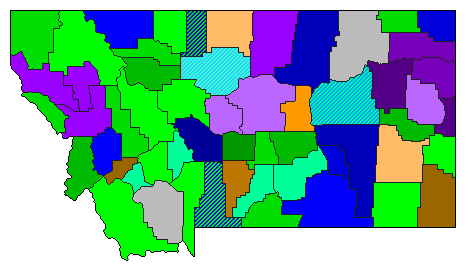
Map Key
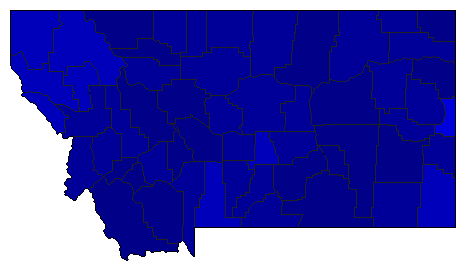
| Turnout
 |  |  |
|
|
| | Election Information: | | Contest Type: | State-run Primary | | Election Date: | 2008-06-03 | | Eligible Participants: | Open (all voters) | | Delegates Awarded in this Contest: | 0 | | Delegates Total: | 25 | | Delegate Allocation Method: Statewide Winner-take-all |
|
| Demographic Data
| 2010 Population: | 989,415 | Enum. | 2010 Population Density: | 2.6 | persons/km2 | | 2008 Population: | 976,415 | Est. | 2008 Population Density: | 2.6 | persons/km2 | | 2000 Population: | 902,195 | Enum. | 2000 Population Density: | 2.4 | persons/km2 | | Total Delegates: | 0 | | Delegates Density: | 39,057 | persons/Del | | Land Area (2000): | 376,979 | km2 | Annual Pop Growth Rate: | 0.9 | % |
| Election Data and Statistics:
| Election Tools
|
| |


