| |
Presidential
Candidate | Home State | Political
Party | Primary Vote | Delegates |
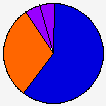
 | John McCain | Arizona | Republican |
634,629 |
59.92% | 85 | 96.6% |
 | Mike Huckabee | Arkansas | Republican |
323,944 |
30.59% | 0 | 0.0% |
 | Ron Paul | Texas | Republican |
49,006 |
4.63% | 0 | 0.0% |
| Mitt Romney | Massachusetts | Republican |
35,192 |
3.32% | 0 | 0.0% |
| Fred Thompson | Tennessee | Republican |
16,366 |
1.55% | 0 | 0.0% |
 | Unallocated | - | Republican |
- |
- | 3 | 3.4% |
 |
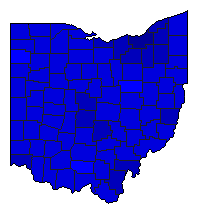
Map Key
| Turnout
 |  |  |
|
|
| | Election Information: | | Contest Type: | State-run Primary | | Election Date: | 2008-03-04 | | Eligible Participants: | Modified Open (members of the party or independents) | | Delegates Awarded in this Contest: | 85 | | Delegates Total: | 88 | | Delegate Allocation Method: Winner-take-all by district and statewide |
- 31 at-large delegates: the candidate receiving the highest number of votes statewide is awarded all 31 delegates.
- 54 district delegates (3 for each of the 18 congressional districts): the candidate receiving the highest number of votes in each congressional district is awarded three delegates.
|
|
| Demographic Data
| 2010 Population: | 11,536,504 | Enum. | 2010 Population Density: | 108.8 | persons/km2 | | 2008 Population: | 11,515,391 | Est. | 2008 Population Density: | 108.6 | persons/km2 | | 2000 Population: | 11,353,140 | Enum. | 2000 Population Density: | 107.0 | persons/km2 | | Total Delegates: | 88 | | Delegates Density: | 130,857 | persons/Del | | Land Area (2000): | 106,056 | km2 | Annual Pop Growth Rate: | 0.2 | % |
| Election Data and Statistics:
| Election Tools
|
| |


