Difference between revisions of "2000 U.S. General Election"
From AtlasWiki
(→U.S. House of Representatives) |
(→Governor) |
||
| Line 138: | Line 138: | ||
==Governor== | ==Governor== | ||
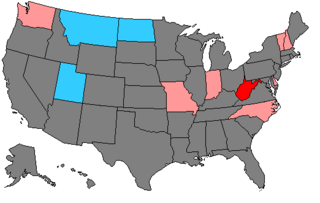
[[Image:2000_Gov_Races_Wiki_1.png|thumbnail|320px|Results -- light blue represents Republican holds, pink Democratic holds, red Democratic pickups.]] | [[Image:2000_Gov_Races_Wiki_1.png|thumbnail|320px|Results -- light blue represents Republican holds, pink Democratic holds, red Democratic pickups.]] | ||
| + | {| border="1" cellpadding="2" cellspacing="0" | ||
| + | |- bgcolor=lightgrey | ||
| + | |style="width:10px"|''' | ||
| + | |style="width:110px"| '''Presidential Candidate''' | ||
| + | |style="width:110px"| '''Party''' | ||
| + | |style="width:60px"| '''Votes''' | ||
| + | |style="width:20px"|'''Vote %''' | ||
| + | |style="width:10px"|'''Won''' | ||
| + | |- | ||
| + | |{{Political Party/party colors/Democratic}}| | ||
| + | | | ||
| + | | Democratic | ||
| + | |style="text-align:right"| | ||
| + | |% | ||
| + | |[[image:yes_check.png]] | ||
| + | |- | ||
| + | |{{Political Party/party colors/Republican}}| | ||
| + | | | ||
| + | | Republican | ||
| + | |style="text-align:right"| | ||
| + | |% | ||
| + | | | ||
| + | |- | ||
| + | |{{Political Party/party colors/Other}}| | ||
| + | | | ||
| + | | Independent Party of Delaware | ||
| + | |style="text-align:right"| | ||
| + | |% | ||
| + | | | ||
| + | |- | ||
| + | |} | ||
Revision as of 15:52, 14 April 2013
The 2000 U.S. General Election was held on November 7, 2000.
Presidential Election
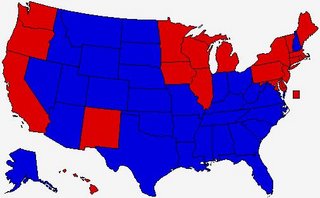
In one of the closest presidential elections in U.S. history, Democrat Al Gore barely lost to Republican George W. Bush. After a close and controversial vicotry for Bush in Florida, he defeated Gore by a margin of 271 to 266, with one DC elector refusing to vote for Gore. This defeat was twice as punishing on Gore as he actually won the popular vote 51,003,926 to 50,460,110.
U.S. House of Representatives
| Party | Total Seats (change) | Seat percentage | |
|---|---|---|---|
| Democratic Party | 212 | +1 | 48.5% |
| Independents | 2 | +1 | 0.5% |
| Republican Party | 221 | -2 | 50.8% |
| Totals | 435 | +0 | 100.0% |
U.S. Senate
| Party | Total Seats (change) | Seat percentage | |
|---|---|---|---|
| Democratic Party | 50 | +4 | 50% |
| Republican Party | 50 | -4 | 50% |
| Totals | 100 | +0 | 100.0% |
Governor
| Presidential Candidate | Party | Votes | Vote % | Won | |
| Democratic | % | ||||
| Republican | % | ||||
| Independent Party of Delaware | % |


